

How Broken Is the Reds' Lineout?
Introducing Event-Adjusted Lineout Efficiency Scores (EALES) to answer whether Reds fans are right to panic about their lineout woes

You can’t read an article about the Queensland Reds right now without reference to their lineout problems over the past few rounds. Commentators, pundits, and fans alike are all asking how a top Super Rugby Pacific team can seemingly be so outmatched at this aspect of the set piece. It certainly doesn’t help that Les Kiss is also the incoming Wallabies head coach, amplifying the scrutiny.
So: is it actually as bad as everyone says?
The Reds 2026 Lineout win rate is 81.2%. The Super Rugby Pacific average sits around 85.5%. The Reds are ~4 percentage points below average. By that single number, the fans look like they’re overreacting. The top of the table Hurricanes have a near identical win rate to the Reds, but nobody is worried about them. The problem is that lineout win rate is a blunt instrument, and it is hiding the real story.
Why Lineout Win Rate Isn’t Enough
Lineout win rate treats every win as equal and every loss as equal. A clean catch at midfield is one win. A scrappy recovery off a mistimed throw at the 5m line is also one win. But we know those have very different importance.
Losses are the same: a not-straight call, a steal in the air, a throw over the top into the breadbasket of an opposing player are all one loss. Events that mean completely different things on the field, but all get the same statistical credit.
Take this example from Super Round: Second half, 50 minutes 14 seconds - Blues lead the Reds 28-21. Reds win a penalty, kick to touch, attacking lineout on the Blues 5-metre line. Matt Faessler throws. Ball is stolen in the air. Blues clear. A try-scoring opportunity dies.
Win rate sees one missed lineout. Anyone watching sees one of the single most damaging throws of the Reds season. A throw that teams win 91% of the time. A golden attacking opportunity turns into close to the worst possible outcome in a match were they ultimately lose in extra time. One throw rarely decides a match. But throws like this one, repeated, decide seasons.
Thats why we’ve developed the EALES metric, to better quantify lineout success or failure.
EALES - Named After the Great Man
EALES stands for Event-Adjusted Lineout Efficiency Score1 and the name is no accident. John Eales is synonymous with Australian Rugby success and one of the best lineout forwards in the history of the game. If Eales is the gold standard, EALES is the measure of how far every lineout unit falls short of him.
The metric has two ingredients:
First: outcome quality. Not all wins are equal, not all losses are equal. EALES grades each lineout based on how it was won or lost. The principle is fairly straightforward:
Clean wins get full credit. Lucky wins (opposition penalty or free kick conceded at your lineout) get only partial credit, because they tell you nothing about your execution.
Messy wins get partial credit. A recovered overthrow keeps the ball, but your process broke. You don’t get the full reward.
Losses are graded by severity. A not-straight call is mild. A steal in the air is bad. A penalty conceded by your forwards at the lineout is worst.
Second: expected difficulty. Not all lineouts are equally hard. A throw on the opposition 5-metre line typically wins around 92% (higher number of no-contest lineouts to counter the rolling maul), while a throw in the opposition half between the 22 and the 10-metre line wins around 85% (defenses contest hard there because winning means an attacking turnover). The difference matters.
The expected-difficulty side of EALES is what football analysts call xG or Expected Goals. xG knows that a tap-in from 2 metres is “the same goal” as a 30-yard volley, but the volley was harder. EALES applies the same logic to rugby lineouts. The model behind it - lets call it xLineout - predicts the probability of winning a given lineout based on field position, opposition defensive quality, and home advantage.
EALES per throw is then simply: what you actually got (outcome value) minus what you should have got (expected value at this difficulty). Average across throws, and you have a rate that tells you how much a team is over- or under-performing relative to their situations.
Since there are 2 parts to every lineout, EALES splits cleanly into three numbers:
EALES Attack - how well your throwing unit executes its own lineouts
EALES Defense - how well your defending unit disrupts opposition lineouts
EALES Net = EALES Attack + EALES Defense - both combined
EALES values are normalised against a global baseline built across all competitons, so a rating of +3 means the same thing whether you’re a SRP team in 2026 or a URC team in 2025. As a reading guide for the score:
10+ is an historically good team
6 to 9 is an elite team
3 to 6 is a good team
-3 to 3 is an average team
-3 to -6 is a bad team
-6 to -9 is a broken team
below −10 is an historically bad team
So, Are the Reds Bad?
Simple answer: Yes. But the Drua are catastrophic, the Hurricanes are doing something strange, and the Reds aren’t even the second-worst on the table.
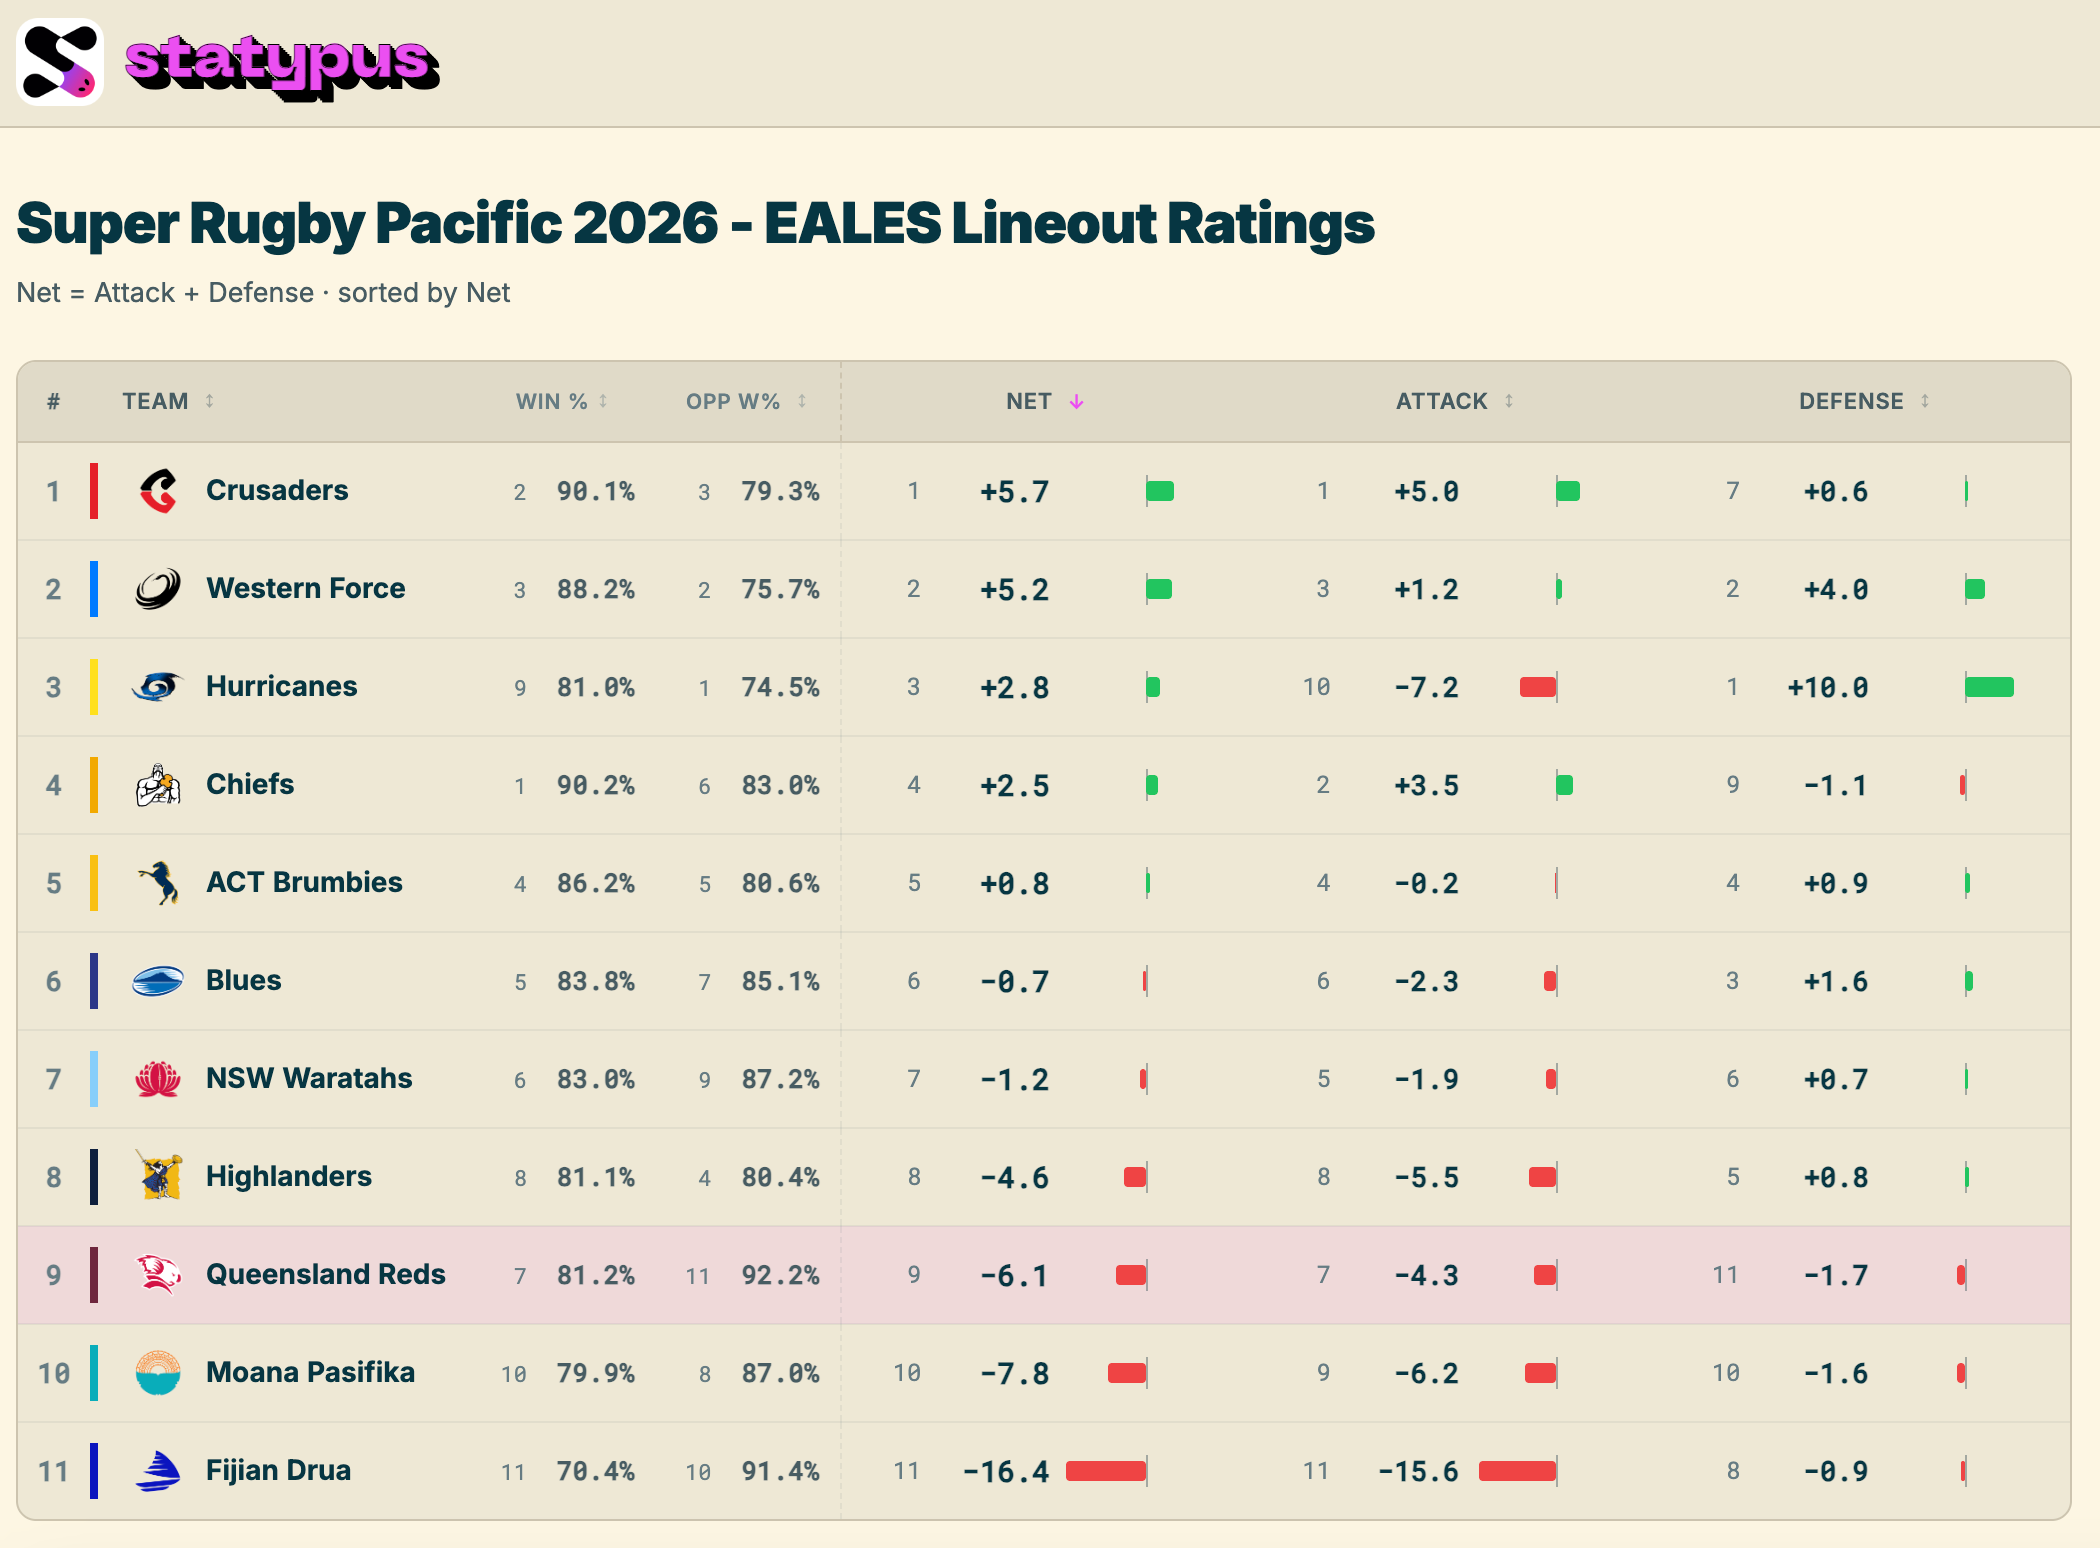
Top of the SRP 2026 table on lineout quality: Crusaders +5.7, Western Force +5.2, and Hurricanes +2.8,. The Reds sit 9th at −6.1. But the Drua are the worst lineout team in the competition by an enormous margin at −16.4.
The Drua’s problem is so consistent across the years that almost nobody bothers to dissect it any more. The fans who’d be moved to debate the Reds lineout already know what to expect from the Drua. There’s no controversy in being last when you’ve been there before.
The Reds get the scrutiny that the Drua don’t because (a) they are supposed to be finals contenders, and (b) their head coach is the next Wallabies head coach. When something that looks broken at this club happens, everybody analyses it.
But ranking 9th of 11 isn’t the most interesting finding. The shape of the badness is.
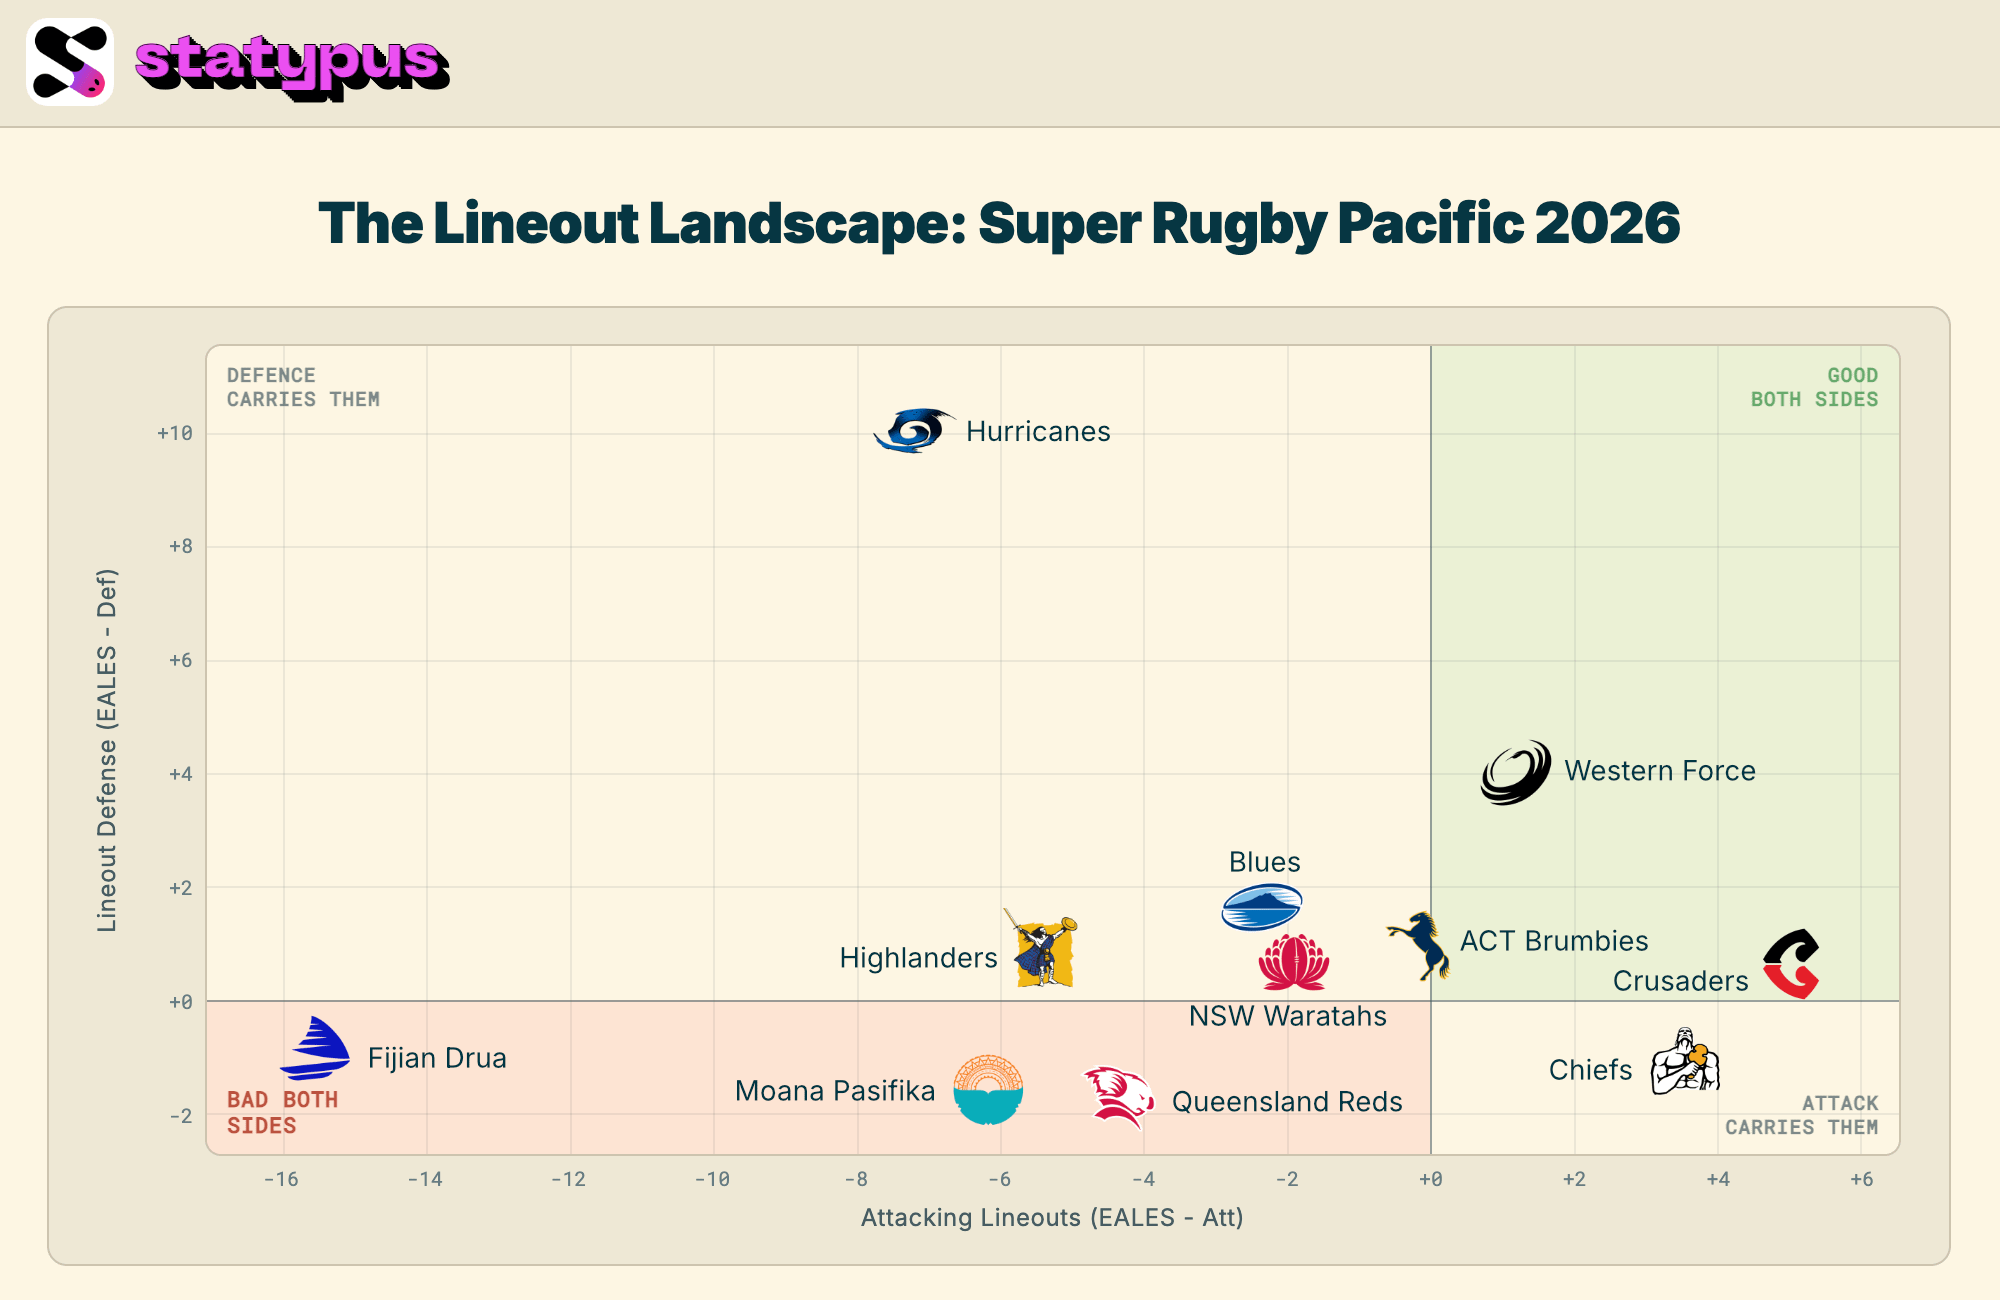
The teams in SRP 2026 split into three clean clusters when you separate throwing from defending.
The good-throwing teams: Crusaders, Chiefs, Force, and Brumbies, all have a positive EALES score for their Attacking lineouts, with varying degrees of competent on lineout defense. Standard “competent lineout unit” territory.
The Lineout Paradox: the Hurricanes are SRP 2026’s most fascinating case. They have the second-worst throwing rating in the league (−7.2, behind only the Drua) which is a rate that should drop the team to the bottom of the table. But they have the best defensive lineout rating in the league at +10.0, a once-a-decade level of disruption, stealing and forcing infringement on opposition throws at a rate nobody else in SRP comes close to. Net result: +2.8, mid-table positive. A great defense is meaningless if your attack is equally broken. But here the great defense is doing more than just covering for the attacking issues. It’s pulling them into the upper half despite their throwers performance. No other team in our dataset illustrates the att/def split as cleanly.
The bottom-left teams: three teams are negative on BOTH throwing and defending, with no compensating strength: the Drua (catastrophic on both, but the attacking rating of −15.6 is the entire story), Moana Pasifika (−6.2 / −1.6), and the Reds (−4.4 on throwing, −1.7 on defending). Everyone else in the bottom half has something working: Highlanders near-neutral defense, Blues and Waratahs decent defensive ratings, Pasifika’s better-than-Reds raw win rate. The Reds and the Drua have nothing to lean on.
This is what EALES reveals that lineout win rate can’t. Most teams have a strength offsetting a weakness. The Drua, Moana, and Reds don’t. The Reds are the only one of the three being talked about.
Where the Reds Lineout Is Actually Breaking
The team-rating answers the question. To understand what’s driving it, we have to look at individual throws and field positions.
The hooker problem
Behind the offensive struggles lies a clear signal in the data: one specific hooker is bleeding lineout value at a rate normally only seen at team-wide collapse.
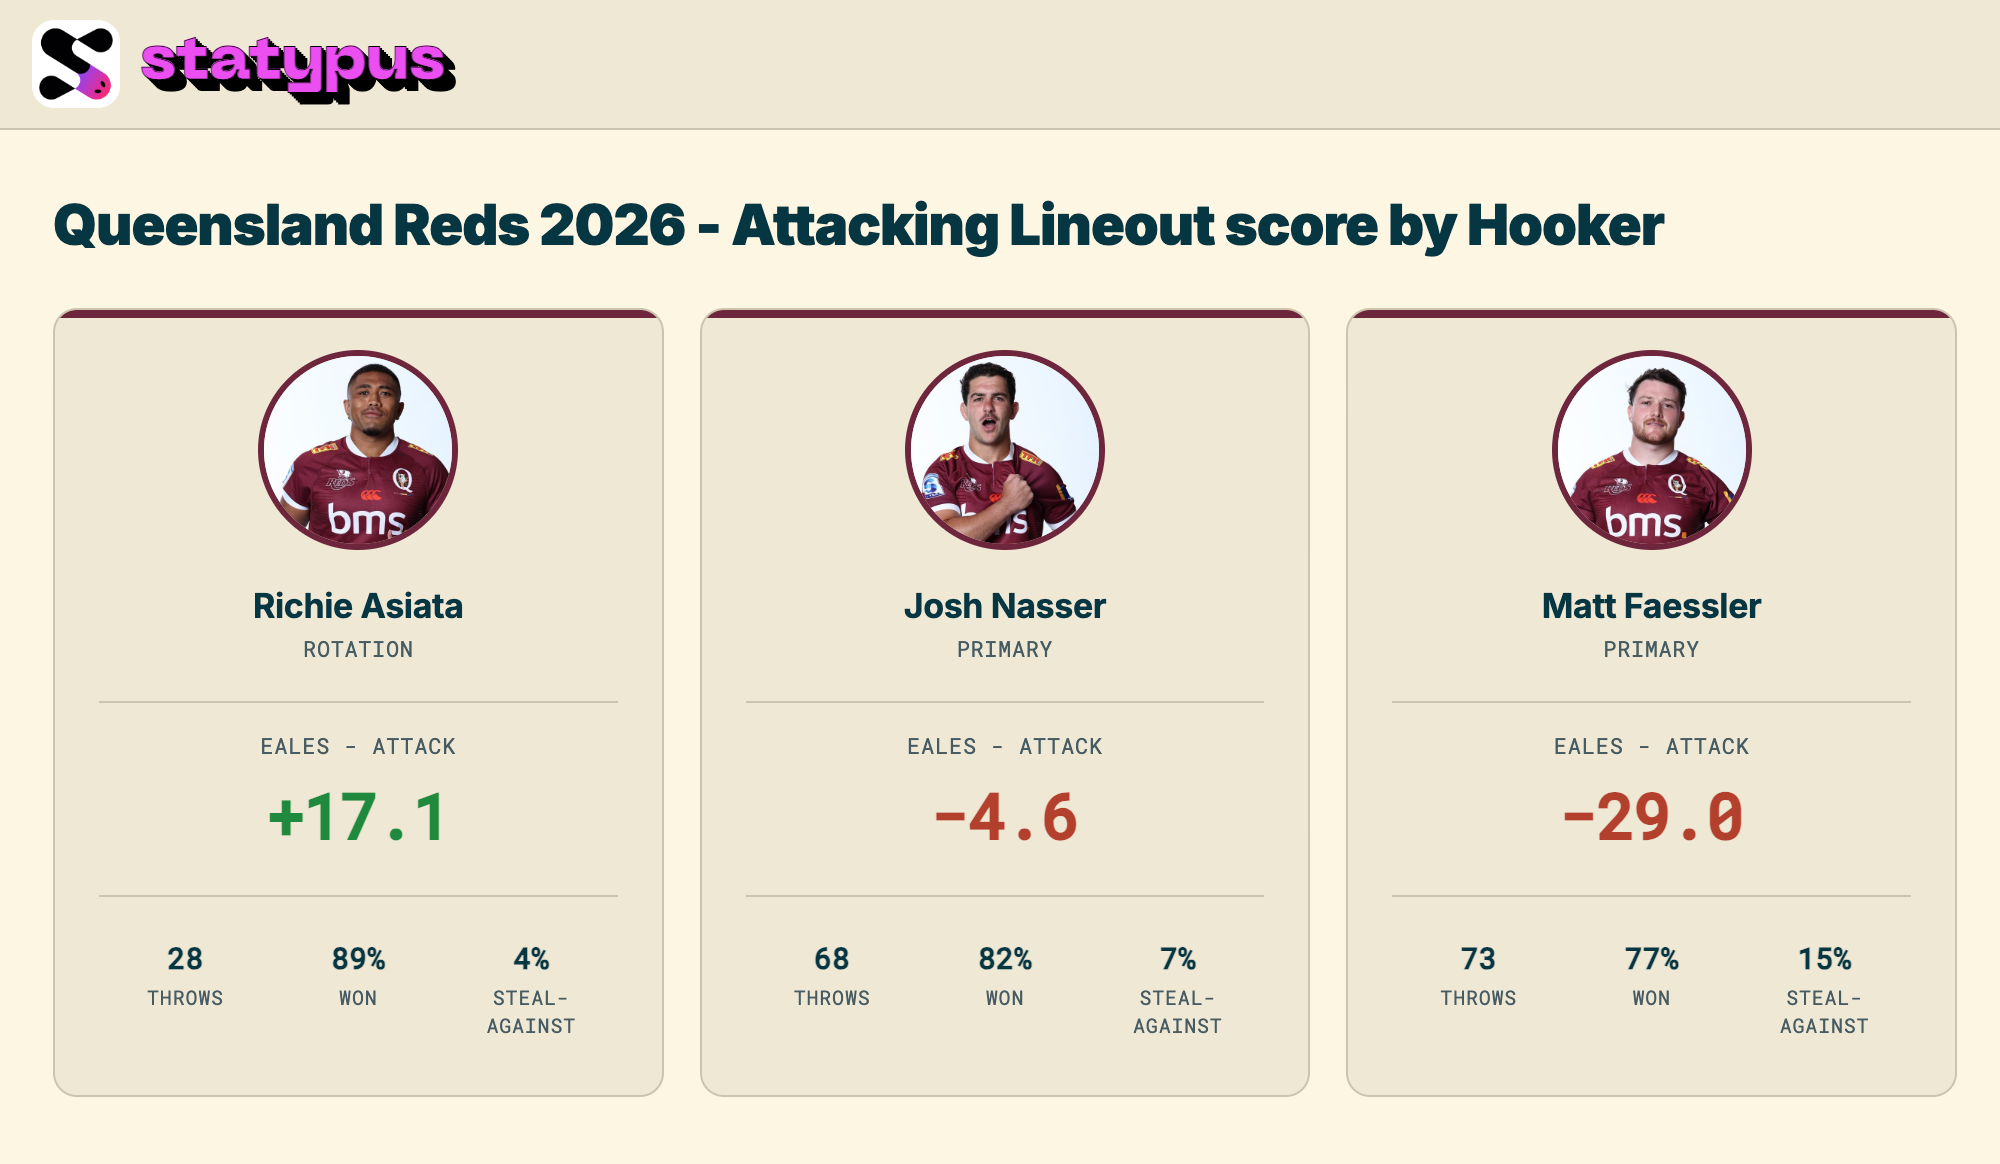
The Reds have rotated three hookers through 2026: Matt Faessler (the current first-choice from Round 8 onwards), Josh Nasser (the primary in Rounds 1–7), and Richie Asiata (the experienced rotation option whose minutes have shrunk through the season). Their individual EALES Attacking numbers:
Richie Asiata: +17.1 (28 throws, 89% won). Well above league average. Clean executor.
Josh Nasser: −4.6 (68 throws, 82% won). Mixed problems - some steals, some overthrows.
Matt Faessler: −29.0 (73 throws, 77% won). Catastrophic-tier execution. Eleven of his 73 throws have been stolen in the air… that’s 15% of his lineouts. For comparison, the SRP 2026 league-average steal-against rate is 7.4%. His throws are being stolen twice as often as an average hooker.
Matt Faessler’s individual EALES score of −29.0 puts him in territory normally only seen at team level. The only SRP team worse than that this season is the Fijian Drua. And the timing matters. In the first seven rounds of 2026 the Reds split throws roughly evenly across Faessler, Nasser and Asiata. Nasser took 54% of throws, with Faessler and Asiata each around 22%. From Round 8 onwards, Faessler became the primary hooker, taking 74.6% of throws while Asiata almost disappeared (7.5%).
The team’s steal-against rate tripled from 5.8% in Rounds 1–7 to 16.4% in Rounds 8 onwards. The selection change and the collapse arrived together.
The data doesn’t tell us why Faessler’s throws are getting stolen - predictable calling, telegraphed delivery, opposition jumpers reading him, mechanical issues, a confidence rut - but it’s very clear that the steals are concentrated in his throws.
A sidenote on what the data can’t see
This is the right point to acknowledge something the metric can’t measure. A lineout is not a hooker throwing a ball into the air. It’s a coordinated act involving the hooker, lifters, a jumper, the timing of the call, and the discipline of the entire lineout pod. EALES sees the outcome of the throw. It cannot see whether a jumper was late, a lifter was off-balance, a call was telegraphed by the receiver’s body language, or the pod was shifted to the wrong slot.
Worth flagging in the Reds case: Josh Canham - the main lineout jumper in 2025 (he played all 15 SRP games last year, and the data shows the Reds throwing to him as the primary target whenever he played) has been out from Round 5 onwards in 2026.
That timing doesn’t quite map to the lineout collapse - the team had positive games in Rounds 5, 6 and 7 without Canham, and the trouble really starts in Round 8 - but it does mean two simultaneous personnel disruptions: their #1 jumper gone, and a few weeks later their primary hooker changed. The combination is plausibly bigger than either single change.
Where on the field
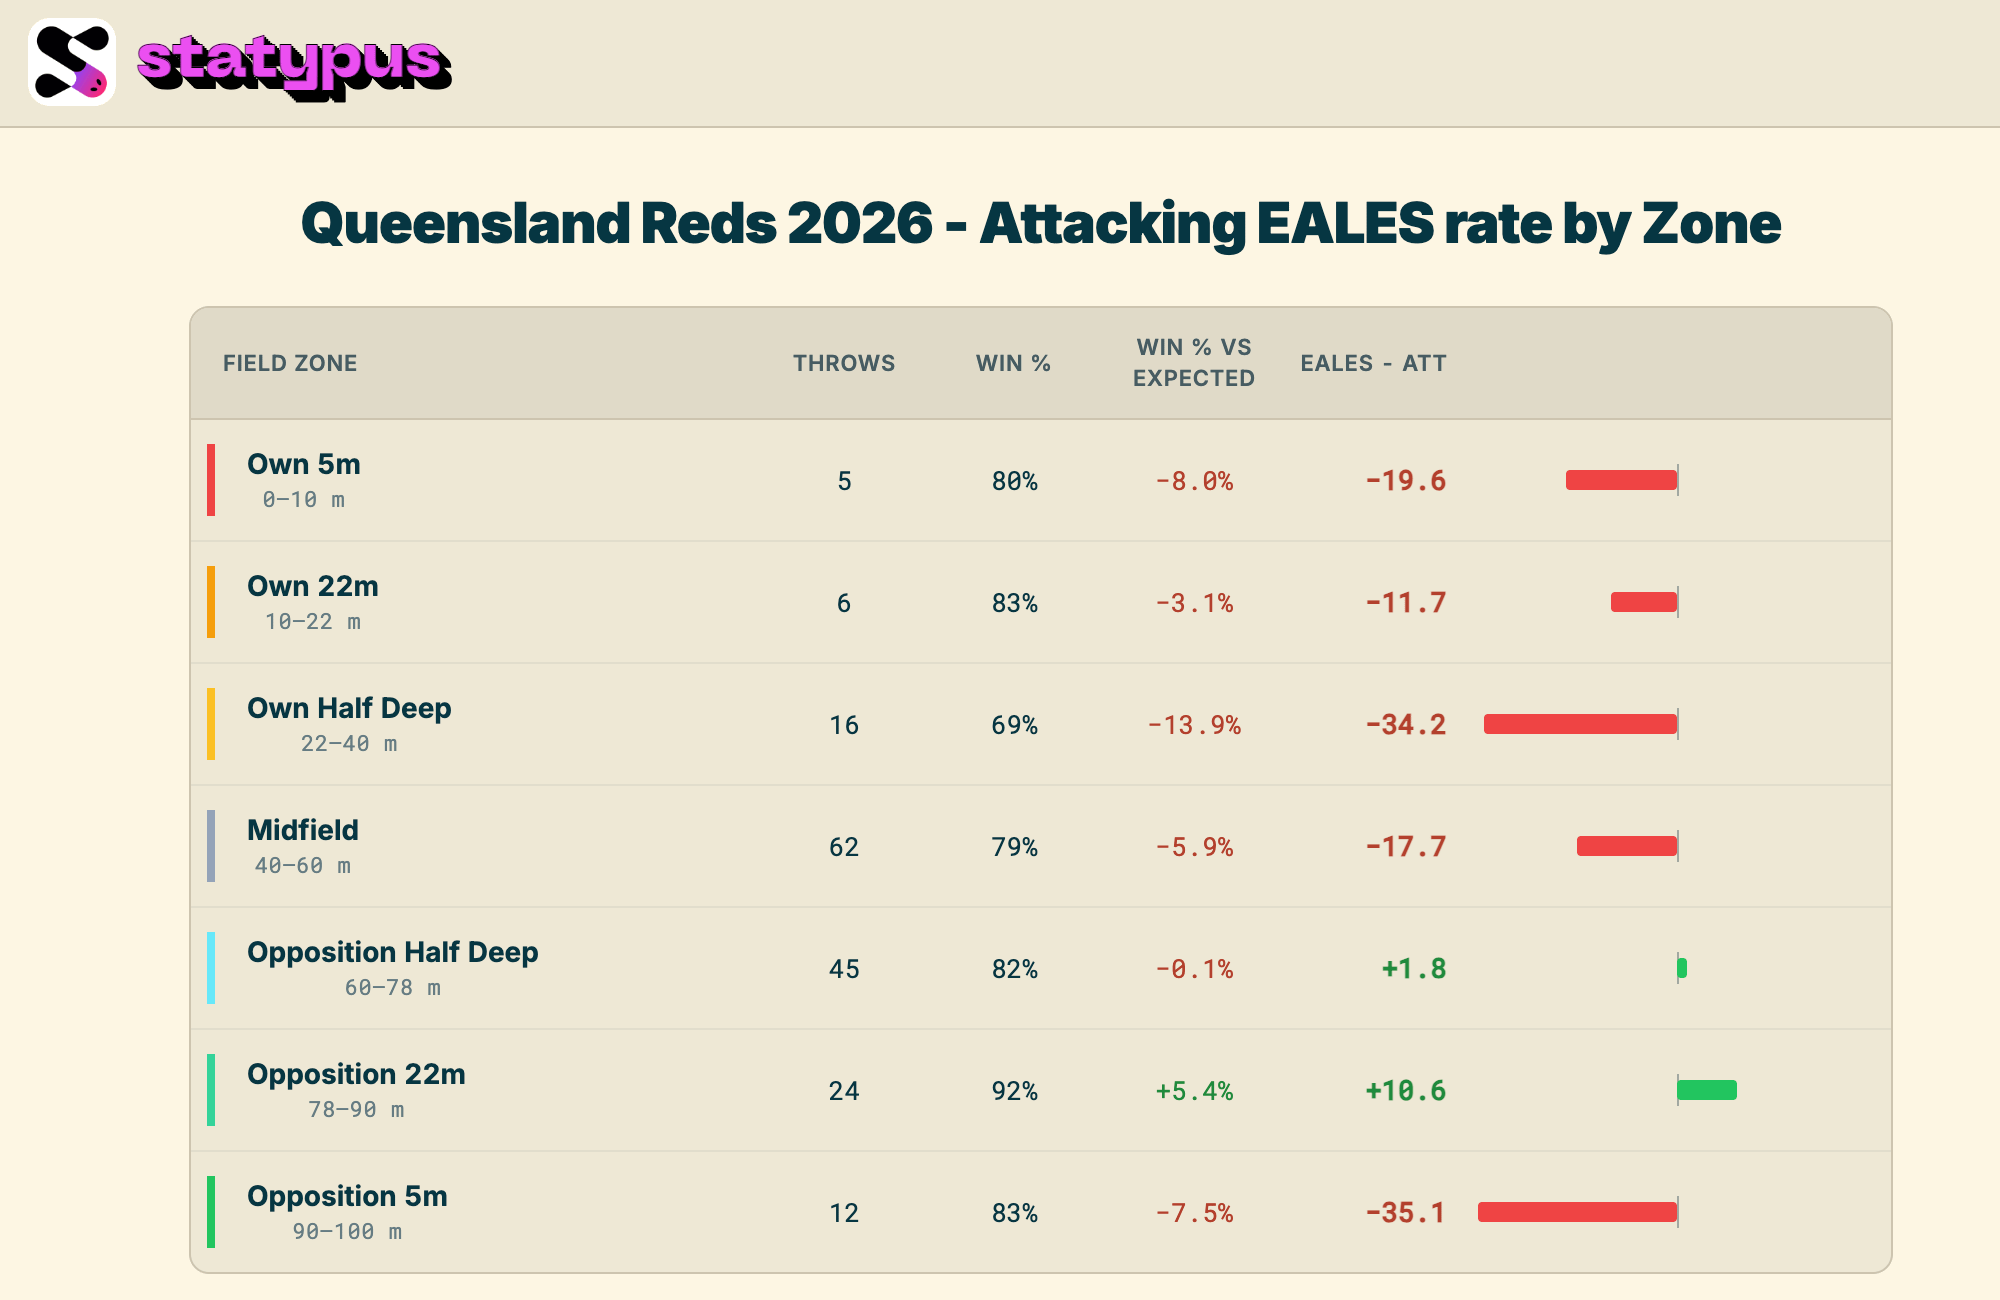
By zone, the Reds’ issues are not where fans assume. The 5-metre attacking lineout (what people call out most often) is too rare to matter much (12 throws). The bleeding is in the midfield (62 throws, where they take a third of their season’s lineouts) and between midfield and their own 22 (16 throws, where they’re winning only 69% of throws against an expected 84%). These are the bread-and-butter lineouts - outside attacking pressure, basic setup. They aren’t winning enough of them.
The defensive side is broken across all field zones, not concentrated anywhere. Opposition throwing teams are winning 92.2% of their throws against the Reds which is the worst defending number in SRP 2026 by 5 percentage points. This failure is independent of the hooker question. Defending an opposition throw doesn’t depend on who’s throwing for your team, and it has been bad from Round 1.
How Bad in Historical Terms?
The team-season story is settled: the Reds are bad this year. The harder question fans are actually asking is “is this the worst the Reds lineout has ever been?” For that, we need an absolute comparison across seasons, not just the season-relative rating we’ve already looked at.
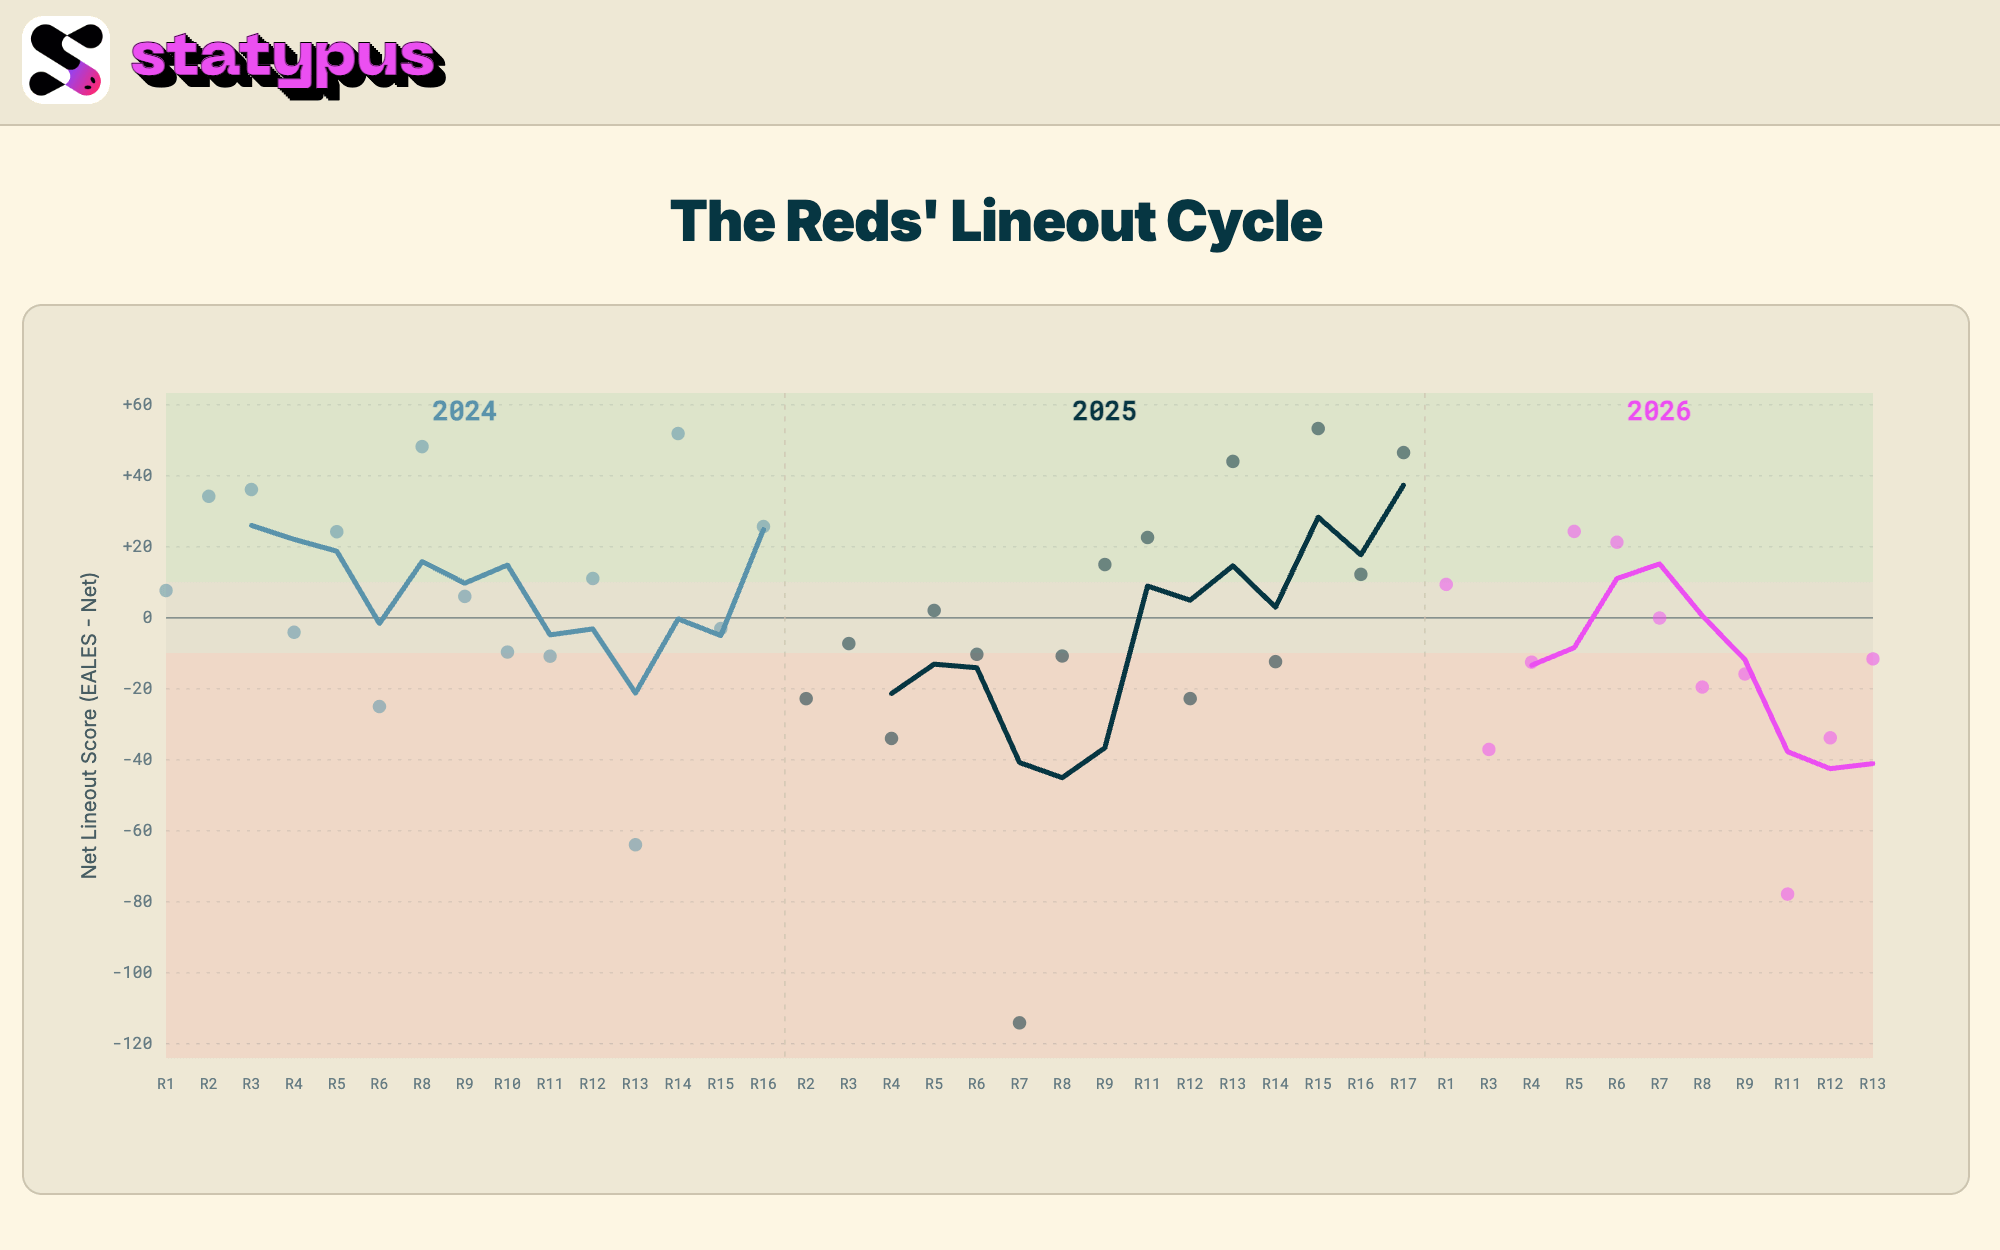
The chart above is per-game net EALES for the Reds across 2024, 2025 and 2026, smoothed to a 3-game rolling average. Three things to notice.
2024 was fine. Average lineout, rolling line bouncing around zero. A normal Super Rugby season.
2025 was volatile but ended well. An early-season run against the Force, Crusaders and Highlanders took the rolling line below −40 (a R7 lineout disruption masterclass by the Force is the lowest single Reds game in our 2024–2026 window). Then a recovery - strong showings against the Blues, Waratahs and Hurricanes swung the rolling line back to positive. Season ended with the Reds emphatically in the green at +37.
2026 is trending in the wrong direction. The first seven rounds were unremarkable, with the rolling EALES bouncing between −15 and +16. But the last five consecutive games - Force (R8), Crusaders (R9), Blues (R11), Brumbies (R12), Chiefs (R13) - have all been negative, with two particularly catastrophic individual games: the Blues at −78 and the Brumbies at −34. The rolling line plummeted past −40 and hasn’t come back.
So is this the worst stretch the Reds have ever had?
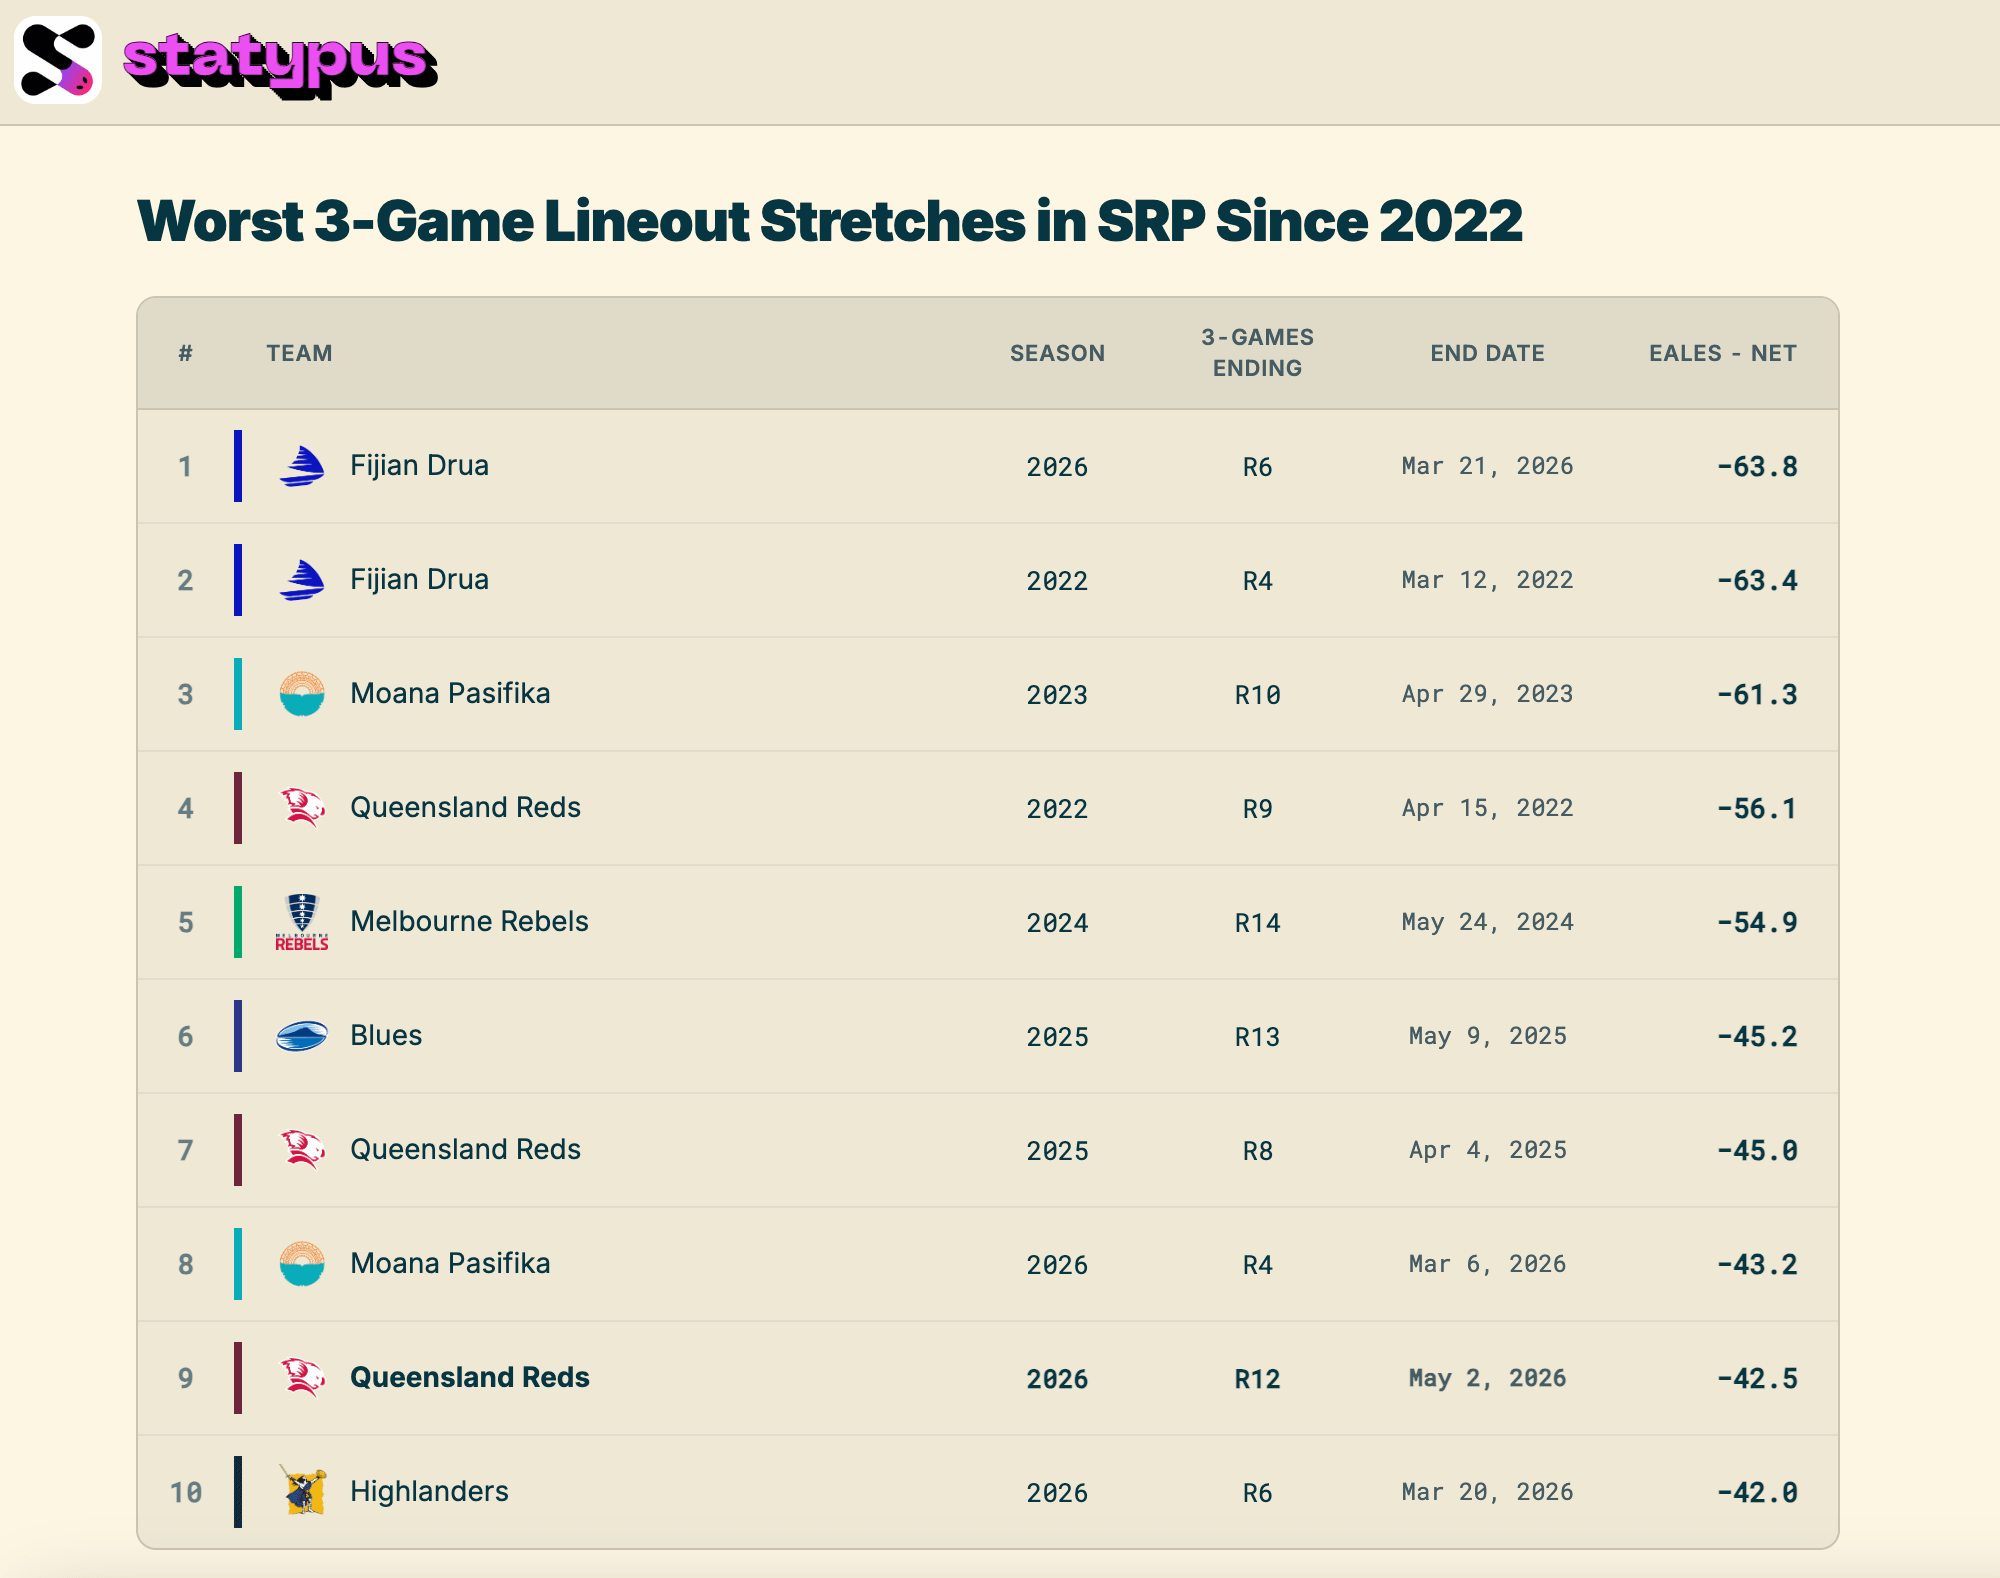
We computed the worst 3-game rolling EALES stretch for every SRP team-season since 2022. The Reds’ current 2026 collapse (worst rolling-3 = −42.5, ending after Round 12) ranks 9th worst in the dataset. Top 16% of all SRP stretches since 2022. Bad. But not the worst.
The worst stretch we have seen was actually the Fijian Drua this eyar (2026) between R3 and R6 (Bye in R4) at −63.8.
And similarly this isn’t even the worst stretch the Reds have had in recent years - that distinction goes to the stretch ending R9 in 2022 at −56.1.
But three of those ten stretches belong to the Reds - this season, last season, and four years ago. Their lineout is not historically broken, but it is cyclically broken. The Reds have had a top-10 SRP-wide bad stretch in three of the last five seasons. 2023 was excellent for them. 2024 was solid. 2025 had a sharp mid-season dip that they recovered from. 2022 and 2026 are the bad years. The cycle is the pattern.
Moana Pasifika are slightly deeper in the bad-lineout pit than the Reds in 2026; the Highlanders are within a hair of them; and the Drua are in a different category of bad altogether. But none of those teams have a finals run on the line, none have a Wallabies coach in charge, and so the conversation about the Reds is the louder one.
So, Are the Fans Right?
Yes - and with three nuances that matter.
1. The 2026 lineout is bad. The Reds rank 9th of 11 in SRP 2026 on the EALES rating. Both their offensive (clearly below average) and defensive (worst-in-league by raw opposition win-rate at 92.2%) sides are negative. They are one of only three SRP teams (with the Drua and Moana Pasifika) without a compensating strength.
2. It’s not historically the worst. The Reds have had worse 3-game stretches before: last season (2025 R8) and a much worse one four years ago (2022 R9).
3. The data points at a specific change. When Matt Faessler became the primary hooker from Round 8 onwards, the team’s steal-against rate tripled. Add in that lock Josh Canham has been out from Round 5, and the team is operating with two visible personnel disruptions overlapping. The metric identifies where the trouble is concentrated. The data can’t tell coaches what to fix; it can only tell them where to look. Whether the answer is reverting the hooker rotation, working on Faessler’s mechanics, varying the call to make it less readable, or simply waiting for Canham to return, is a question for the people on the training paddock.
I think it’s safe to say the Reds’ lineout is broken right now. But they’ve had this issue before and they’ve come back from it before. Whether 2026 follows that pattern, and whether that recovery can occur before the finals, is the real question.
The Weekend Ahead
Unfortunately for Reds fans, this doesn’t look like the week that the lineout will get back on track. Thy travel to HBF Park to play the Western Force, and the last 2 meeting between the sides tell a hard-to-ignore story:
Round 7, 2025: Reds threw 20, 8 stolen (40%). One-off catastrophe - the single worst Reds lineout day in three seasons.
Round 8, 2026: Reds threw 15, 2 stolen (13%, double league average). The first game of the 2026 collapse run.
The Force defensive lineout has moved up sharply in 2026 and sit at +4.0 EALES Defense, second-best in SRP behind only the Hurricanes. They read opposition throws as well as any unit in the league. The Reds, going to Perth, are bringing the league’s worst opposition-win-rate defence (92.2%) and the league’s most-stolen primary hooker. The matchup favours the Force on both halves of the lineout battle.
Watch the steal-against rate. If the Reds are stolen at or below the league average of 7% this weekend, it’s a good data signal that the 2026 cycle is breaking. If it climbs back toward double-digit, the cycle is deepening.
This is the first piece on the EALES framework. We’re also building the equivalent framework for scrums, kicking, and overall player impact. If you have a club you’d like to see broken down, get in touch.
Methodology
xLineout model. Two parallel logistic regressions, one for each EALES perspective, applying the principle “don’t use the thing you’re measuring as a feature”:
Attacking model (for EALES Att, measures throwing-team quality) features: 7 field-zone dummies, home/away binary, plus 2 continuous features describing the defending team’s strength (Opposition Steal Rate, Opposition Pressure Rate). No throwing-team identity.
Defensive model (for EALES Def, measures defending-team quality) features: 7 field-zone dummies, home/away binary, plus 2 continuous features describing the throwing team’s strength (Thrower Win Rate, Thrower Clean Win Rate). No defending-team identity.
Both models trained via 5-fold cross-validation by game cross the combined 2025+2026 schema-stable scope (n = 13,058 throws). Each event is predicted by a model that never saw any event from its own game. Calibration: predicted-vs-actual win rate within ±0.4 percentage points across all 7 field zones for both models.
Outcome-points weights. Manually calibrated under an “execution-quality” framing — luck-wins (opposition penalty or free kick conceded at your lineout) score lower than clean wins because they carry no execution signal. Major loss weights anchored on loss via handling error, with lost via penalty as the worst possible outcome. Rank correlation between the manual weights and an empirical “post-lineout points delta” calibration: Spearman 0.82–0.88.
Field-position leverage multiplier. Each per-event EALES contribution is multiplied by a field-zone leverage factor before aggregation: 5-metre zones (own and opposition) × 2.0, 22-metre zones × 1.5, midfield and half-deep zones × 1.0. This captures the fact that a steal at the opposition 5-metre line manufactures (or prevents) a try, while a steal at midfield only changes possession of broken-play space. Without leverage, EALES would treat both events as equally valuable.
Seasonal Rankings. The team-season rankings (Section 4) use a global trimmed-baseline normalisation: per-match raw EALES (V=15 lineouts) is standardised against the mean and standard deviation of the middle 80% of team-seasons in the full schema-stable dataset, with separate values for Attack and Defense so the two columns read on a comparable percentile scale. The presentation multiplier K=3 puts typical good/bad teams in ±3, elite/broken units in ±6–9, and historic outliers beyond ±10.
Defender weights are separate from thrower weights. The attacking team is supposed to win lineouts in a perfect world (~87% base rate), so a defender allowing a clean opposition win (won clean) is the near-default outcome, and scored small to register passivity without overweighting it. Defenders score strongly positive for active disruption (steals, contested wins, forced opposition infringements) and strongly negative for active mistakes (own infringement at the lineout). Maximum defender positive is set deliberately lower than the maximum thrower positive, reflecting that an aerial steal is more impressive defensive execution but a clean catch is the larger possession-value outcome.
Have you tracked how often teams compete at all? It looks to me (anecdotally) that the Reds rarely contest opposition throws, sacrificing the potential for the opposition hooker to be called up on not straight.
Would love to see what rate opposition hookers are getting pinged for this against the Reds compared to other teams, it could be a very easy boost to throw up some token competition more often if they're lagging there.
Mate, mind blown, and absolutely love the article!
Even if it's depressing reading as a Reds fan.