

The Efficiency Playing Field: Introducing Rugby team efficiency metrics

Now that the Super Rugby season has (mostly) hit the half-way point, there is a large enough sample to start looking at how teams are performing. Inspired by the efficiency charts Kirk Goldsberry produces for the NBA, I've borrowed the concept to apply to Super Rugby.
What is efficiency?
Efficiency of Attack is the number of points a team scores per 100 carries. A higher number signifies a more efficient attack, since it takes you less carries to score a point.
Efficiency of Defense is the number of points a team allows per 100 opposition carries. A lower number is a more efficient defense, since it takes your opposition more carries to score a point.
Net Efficiency is the difference between Efficiency of Attack and Efficiency of Defense. A positive Net Efficiency means you scored more points than you conceded given equal possession.

The quadrant above charts efficiency of attack against efficiency of defense, with the center lines being the average of all teams.
The top right quadrant is where you want to be, since it means you are above the league average in both efficiency of attack and defense. Conversely the bottom left quadrant is not where you want to see you favourite team, as it means they are below average in both phases of the game.
Being in either of the other two quadrants is a mixed bag - you are above average in one aspect of the game but below average in the other. In this case you want to look at the diagonal Net Efficiency line. If you are above the line, you have a positive Net Efficiency, and score more points than you concede. If you are below, it's the opposite.
What does The Efficiency Playing Field tell us about Super Rugby teams?
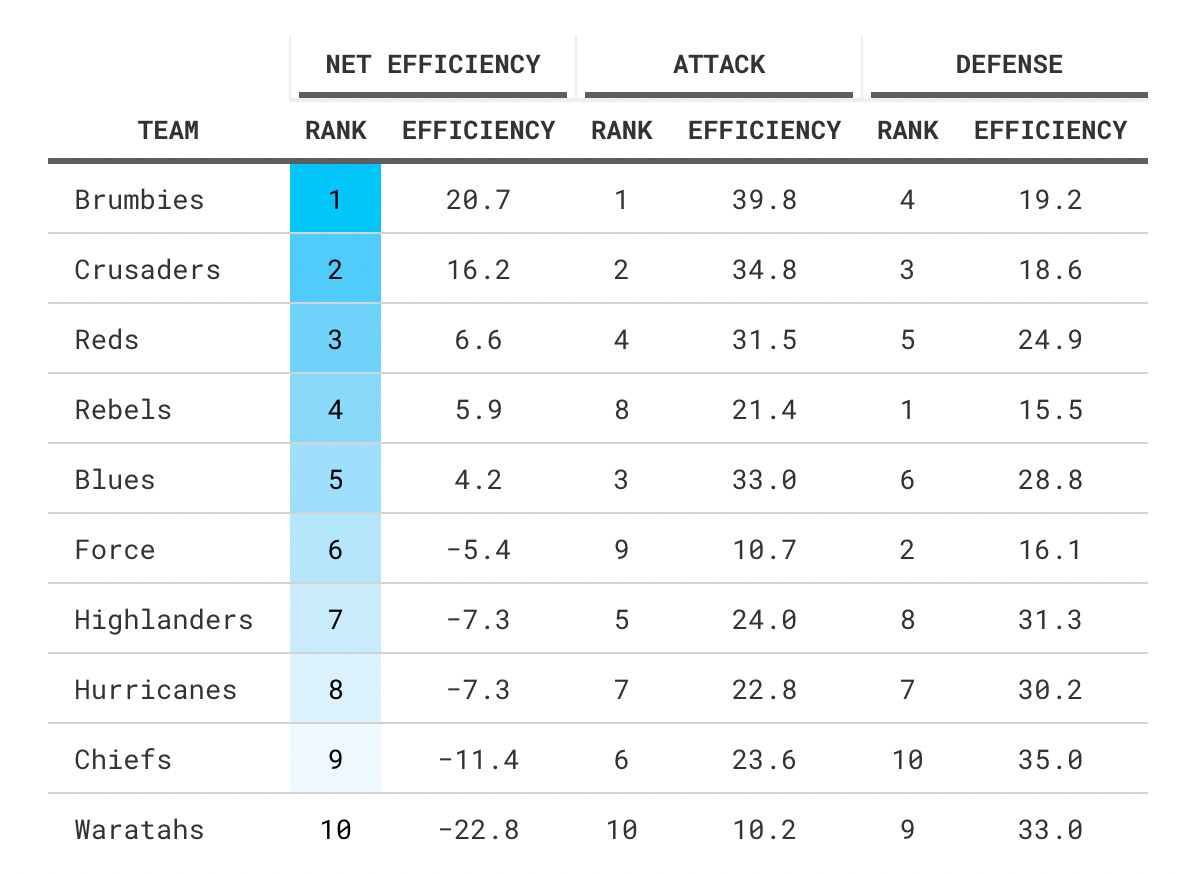
The Brumbies lead both conferences with the number one net efficiency rank. This is driven by a huge Efficiency of Attack score of 39.8, which is 5 points clear than the number two Crusaders. This number is slightly misleading though, since their 61-10 Week 2 trouncing of the Waratahs is having an outweighed effect on this number. I'd expect this number to come back to the field as the season goes on and more games are factored in.
The Rebels lead the league in Efficiency of Defense, only letting their opponents score 15.5 points per 100 carries. Even though their Efficiency of Attack has been sub-par, the stinginess of their defense means they still have a positive Net Efficiency score of 5.9.
The Force come in number two in the efficiency of defense ranking, however unlike the Rebels they are let down by their poor efficiency of attack leading to a negative Net Efficiency score of -5.4.
At the other end of the spectrum are the Chiefs and Waratahs, who rank 9th and 10th in Net Efficiency. The Chiefs are brought down by their league worst defense, allowing 35 points the their opponents per 100 carries, however one bright spot is their efficiency of Attack is middle of the pack.
The Waratahs on the other had are woeful on both sides of the ball. Their offense is ranked dead last, and their offense is second last.
What stands out to you?