

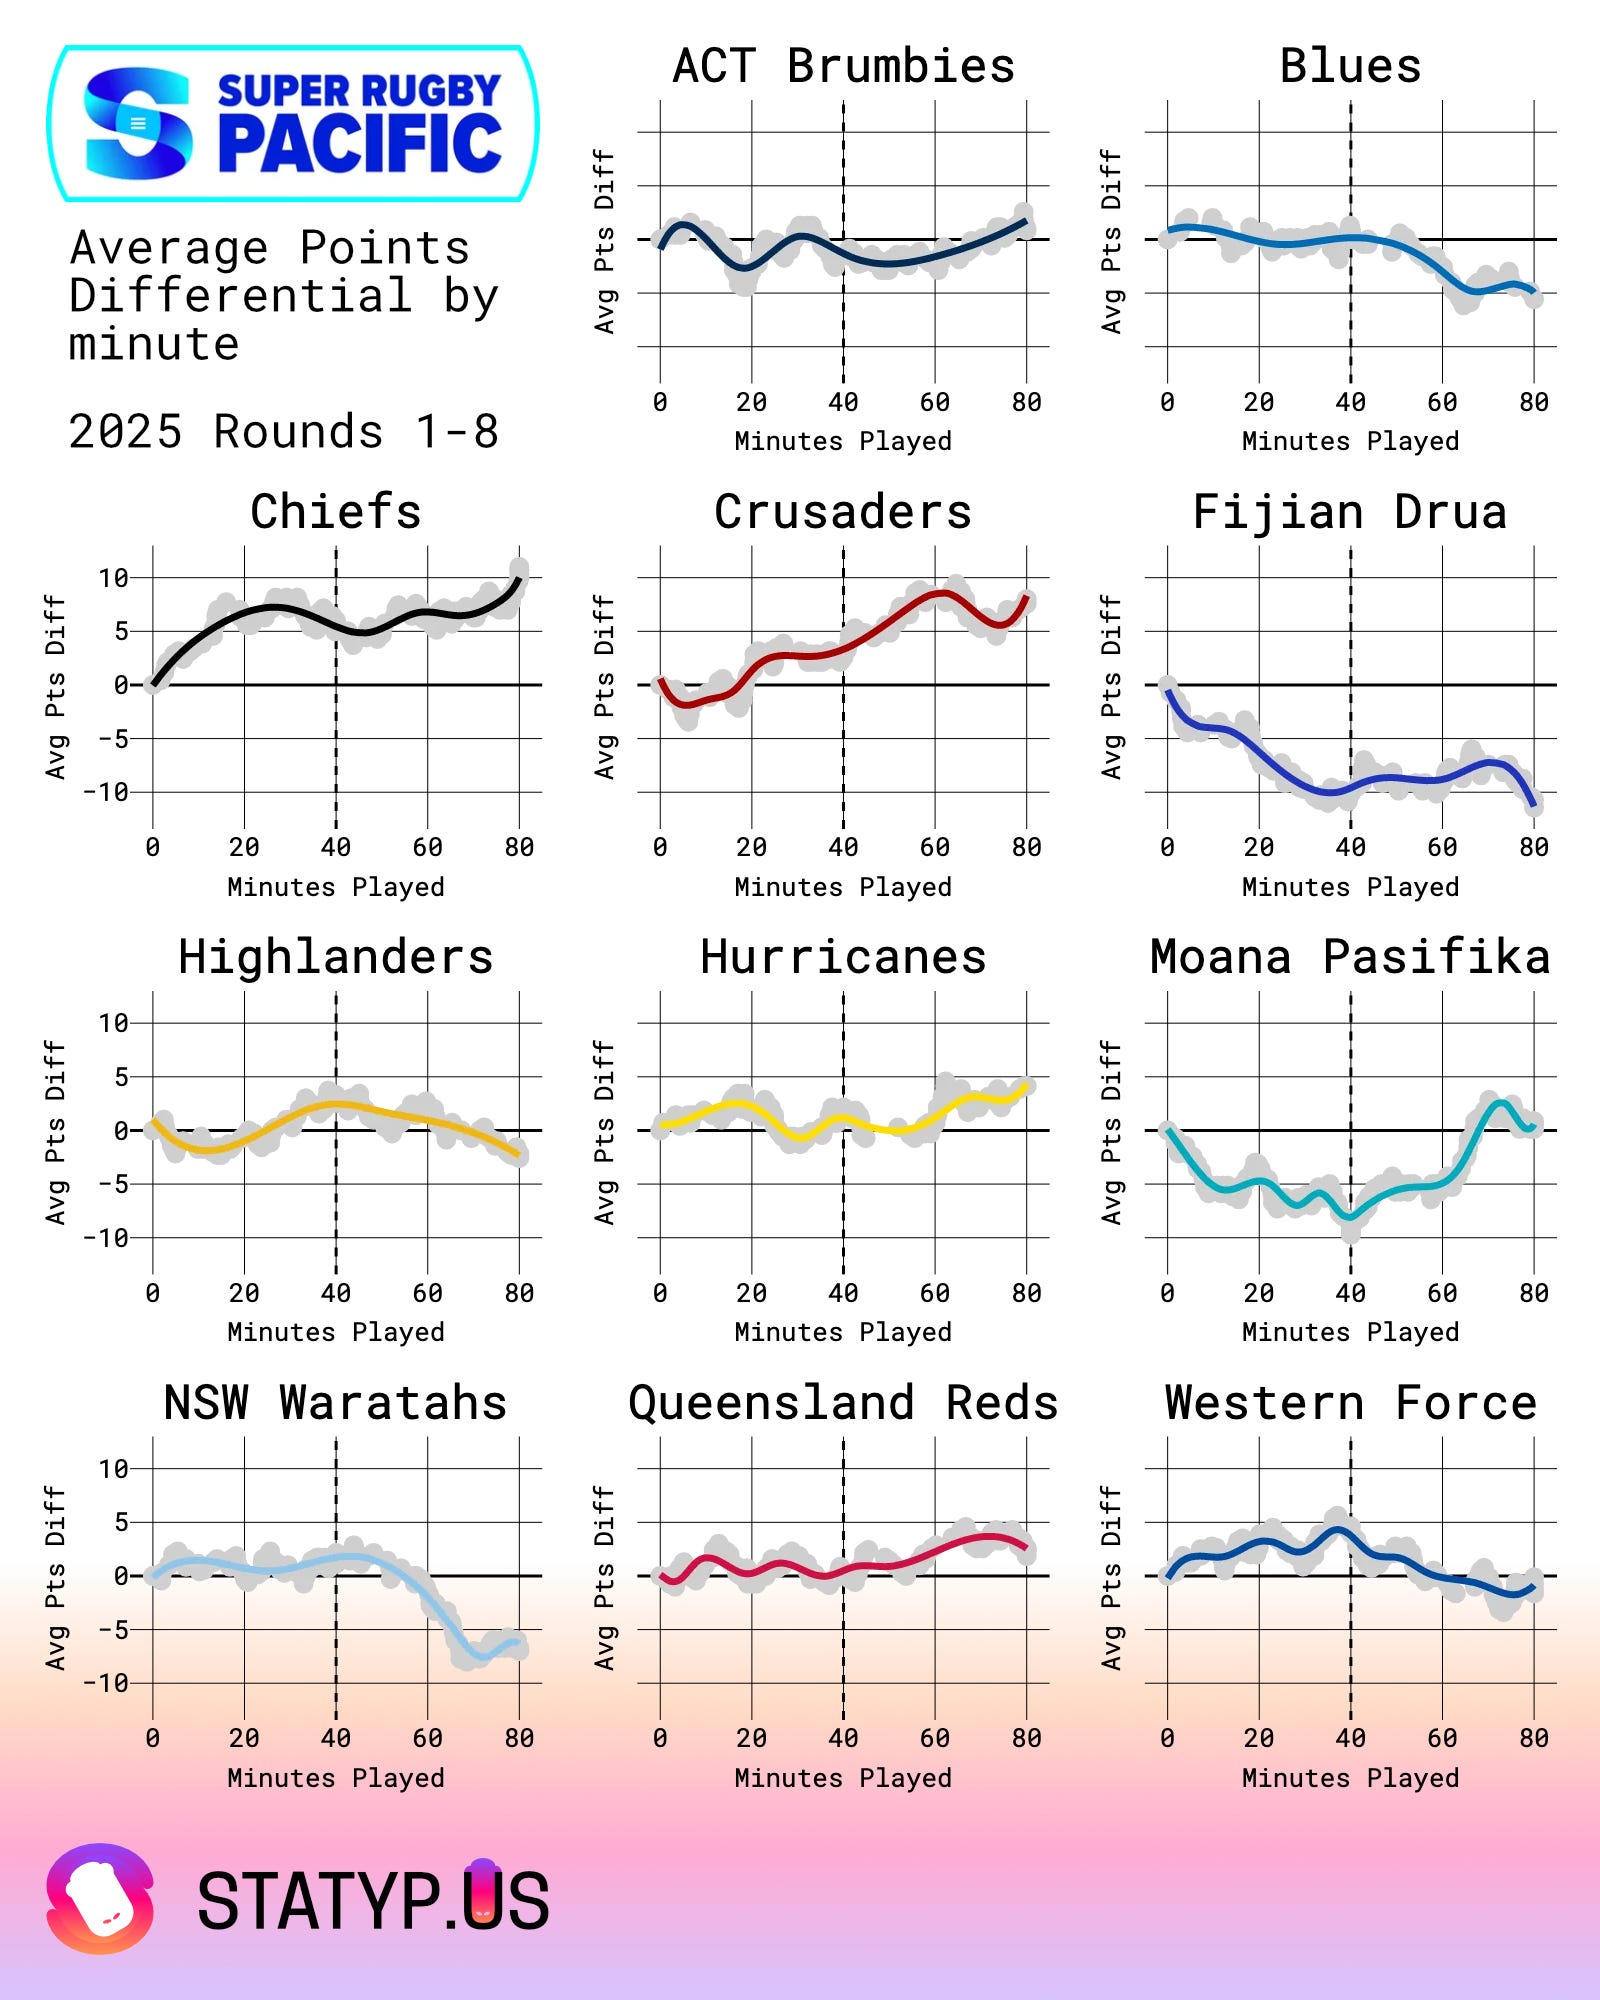
How Super Rugby Teams Score (and Collapse): A Minute-by-Minute Breakdown
Scoring Differential in Super Rugby Pacific 2025 (Rounds 1-8)

I came across the concept of average points differential charts via Sebastian Carl of nflverse fame. Each year, he produces these for the NFL, and I find it such an interesting way to visualise how different teams tend to score throughout the game.
Now that the Super Rugby Pacific season has passed the halfway point, it seemed like as good a time as any to apply the same technique to scoring from Rounds 1–8 — particularly given how close the games have been overall this season.
For the uninitiated, these curves show the average number of points a team is ahead or behind (their points differential) at every minute of a match. To do this, we look at all the games a team has played. Every time a team or their opponent scores1, we update the average score differential for that point in time. Put another way: imagine overlaying every match’s scoring worm and averaging them together.
It’s not a perfect analysis. One or two blowouts can skew the results (see the Hurricanes’ second-half demolition of the Waratahs), and while every match is weighted equally, the final scoreline doesn’t always tell the full story. But these curves help visualise (and often confirm) the patterns and narratives we feel as fans. And yes, it turns out the Crusaders really do finish strong.
Below is my quick interpretation of how I read this for each team. Feel free to agree, disagree, or throw your own hot take into the mix.
ACT Brumbies
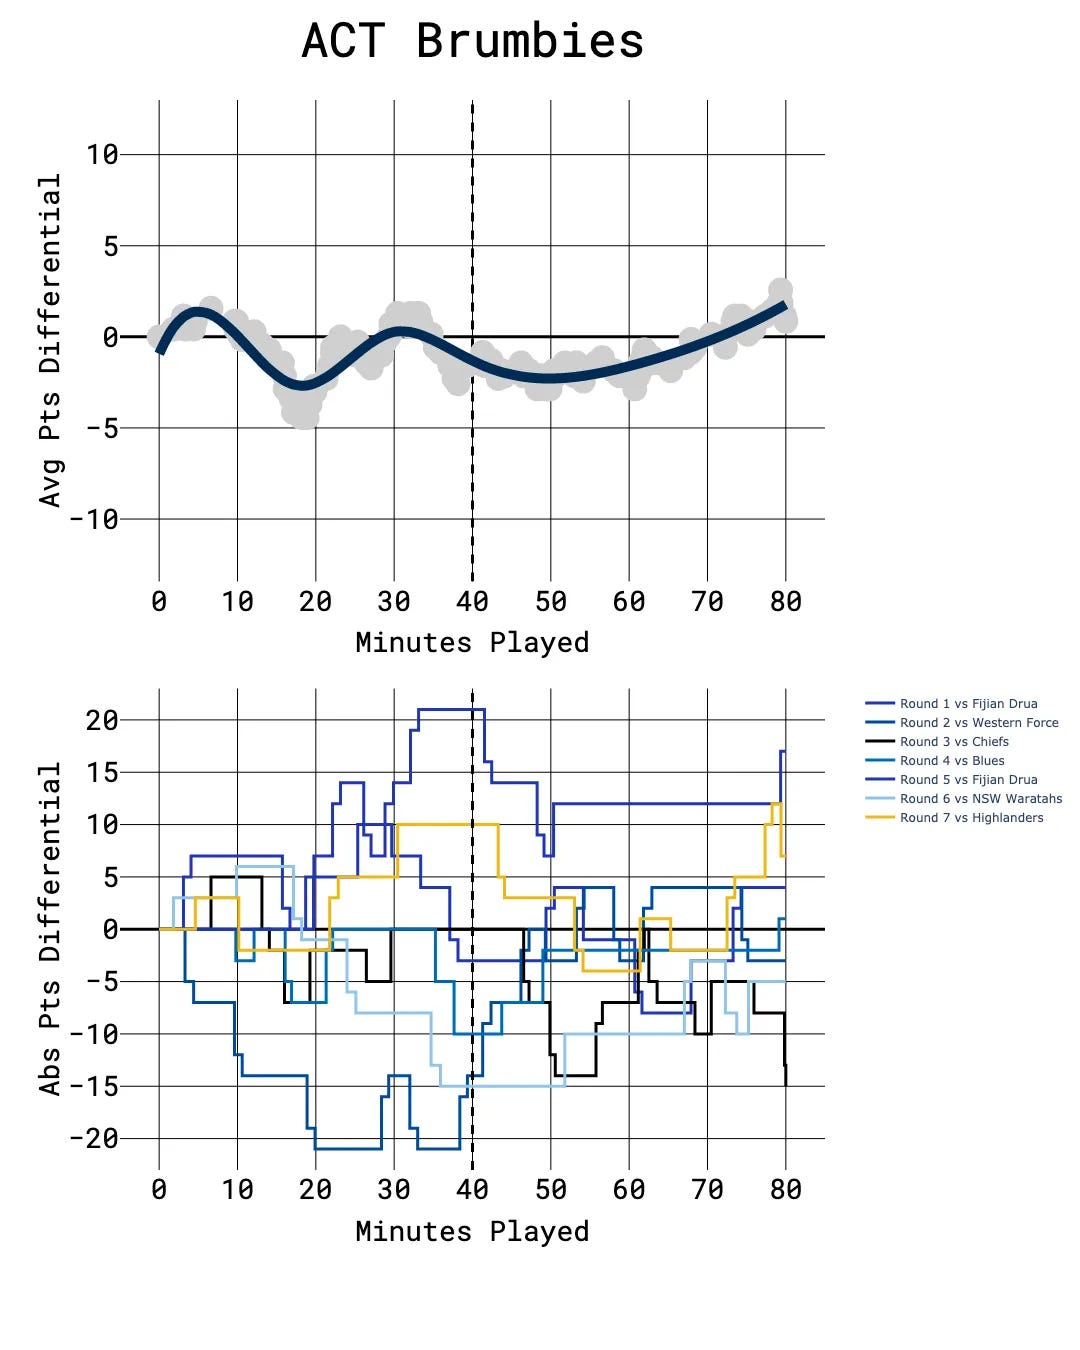
The Brumbies are just a solid team. Their average point differential stays mostly within a tight range early, and they keep their composure in the final 20 minutes of games. On an individual game level, we can see they’re not blowing teams out, but they’re rarely out of contention either. The average smooths over some back-and-forth tussles, but the key trend holds: the Brums finish stronger than they start. That steady late-game rise isn’t fluke—it’s consistency, game management, and bench impact doing their job. No wild swings. Just pressure applied until the other side breaks.
Blues
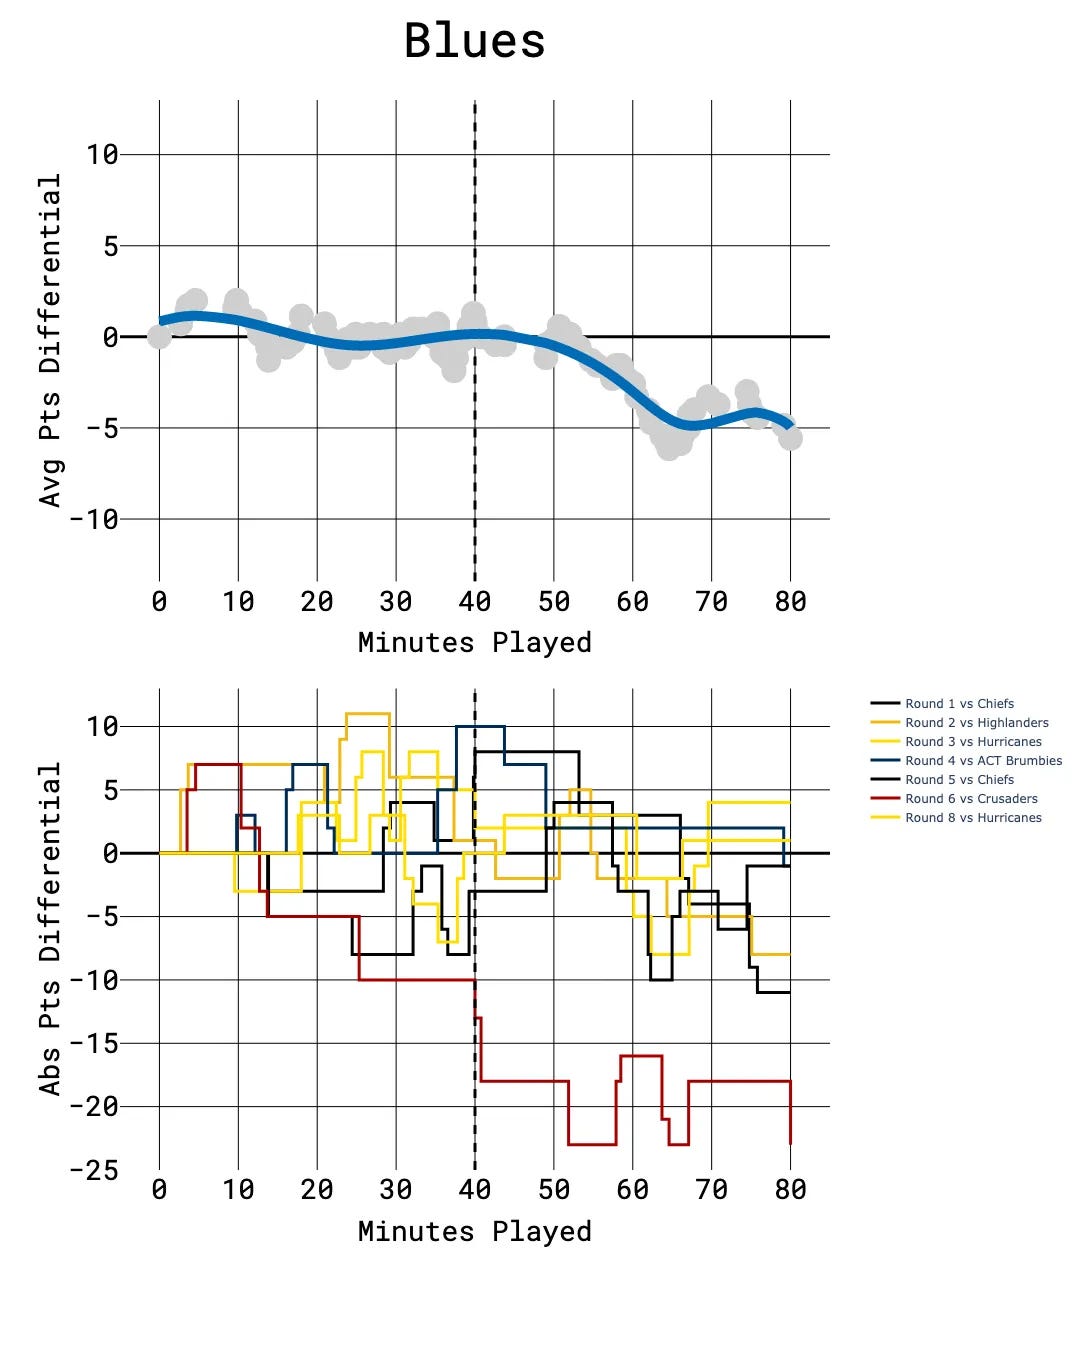
The Blues are a bit of a slow burn—but not in a good way (especially for a defending champion). They tend to start off okay, holding their own through the first half and often sitting in positive or neutral territory. But after halftime, the bottom starts to fall out. Their average point differential steadily declines all the way to the final whistle. And when you look at the individual games, it’s not just one or two blowouts dragging them down—it’s a clear pattern of second-half fade-outs. They just haven’t figured out how to close games out.
Chiefs
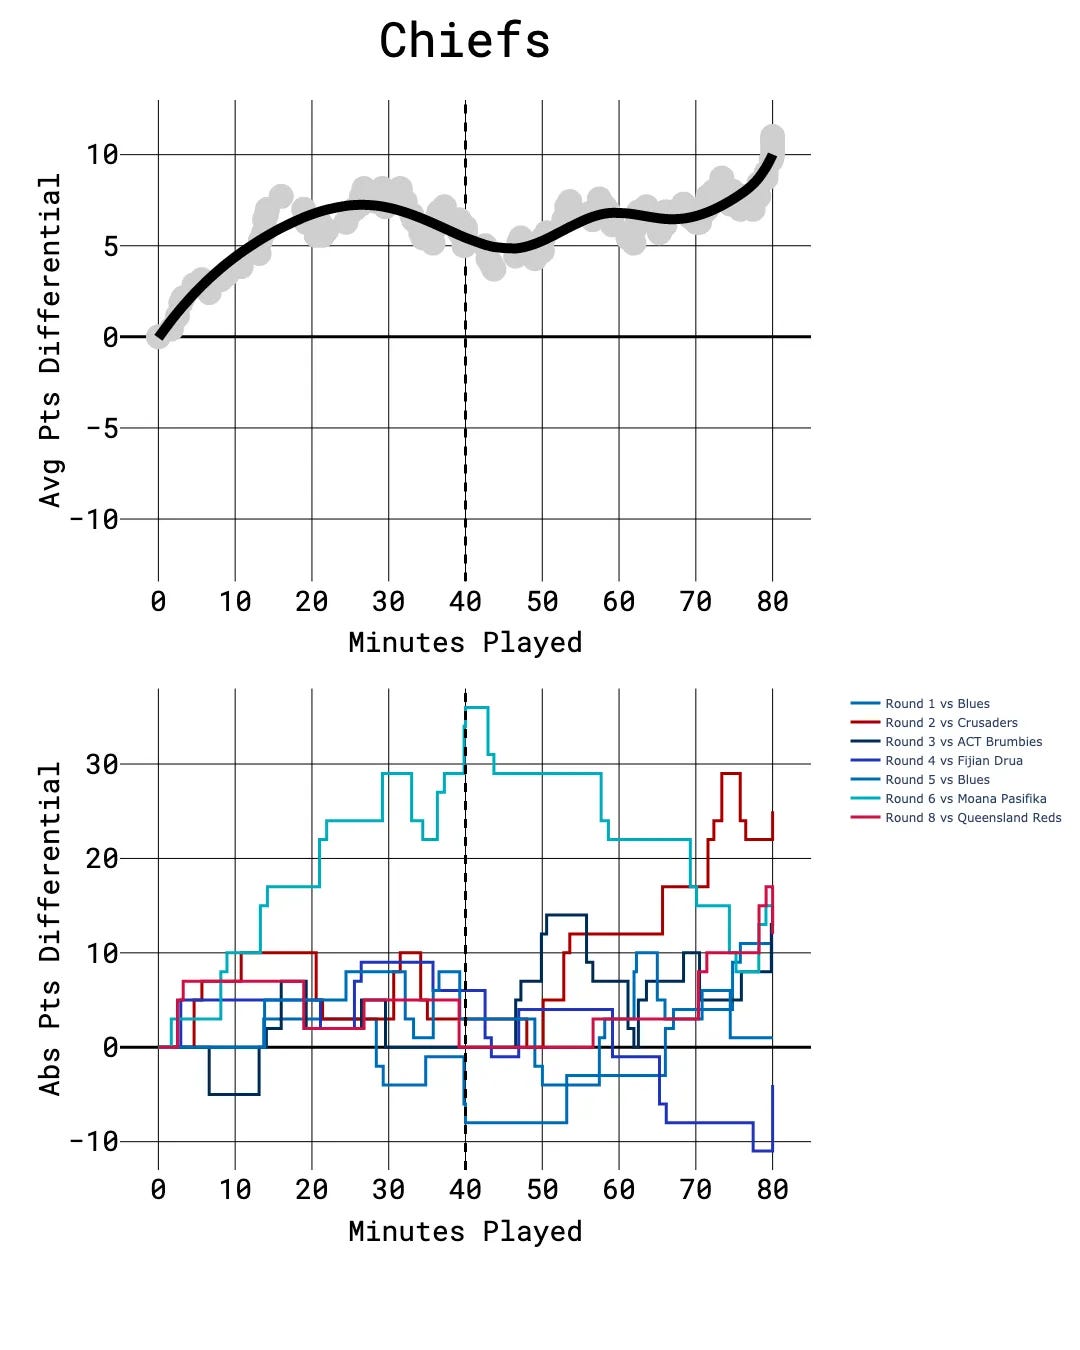
The Chiefs feel like a team that does their best work before the break. Their average point differential shoots up in the first 30 minutes as they pile on early scoreboard pressure. But what’s interesting is that they don’t necessarily keep that momentum going. The second half flattens out—while they’re rarely in trouble, they’re also not putting teams away. They hit hard early and then shift into game management mode. If you’re not switched on in the first half, the Chiefs will make you pay. They’re top of the table for a reason.
Crusaders
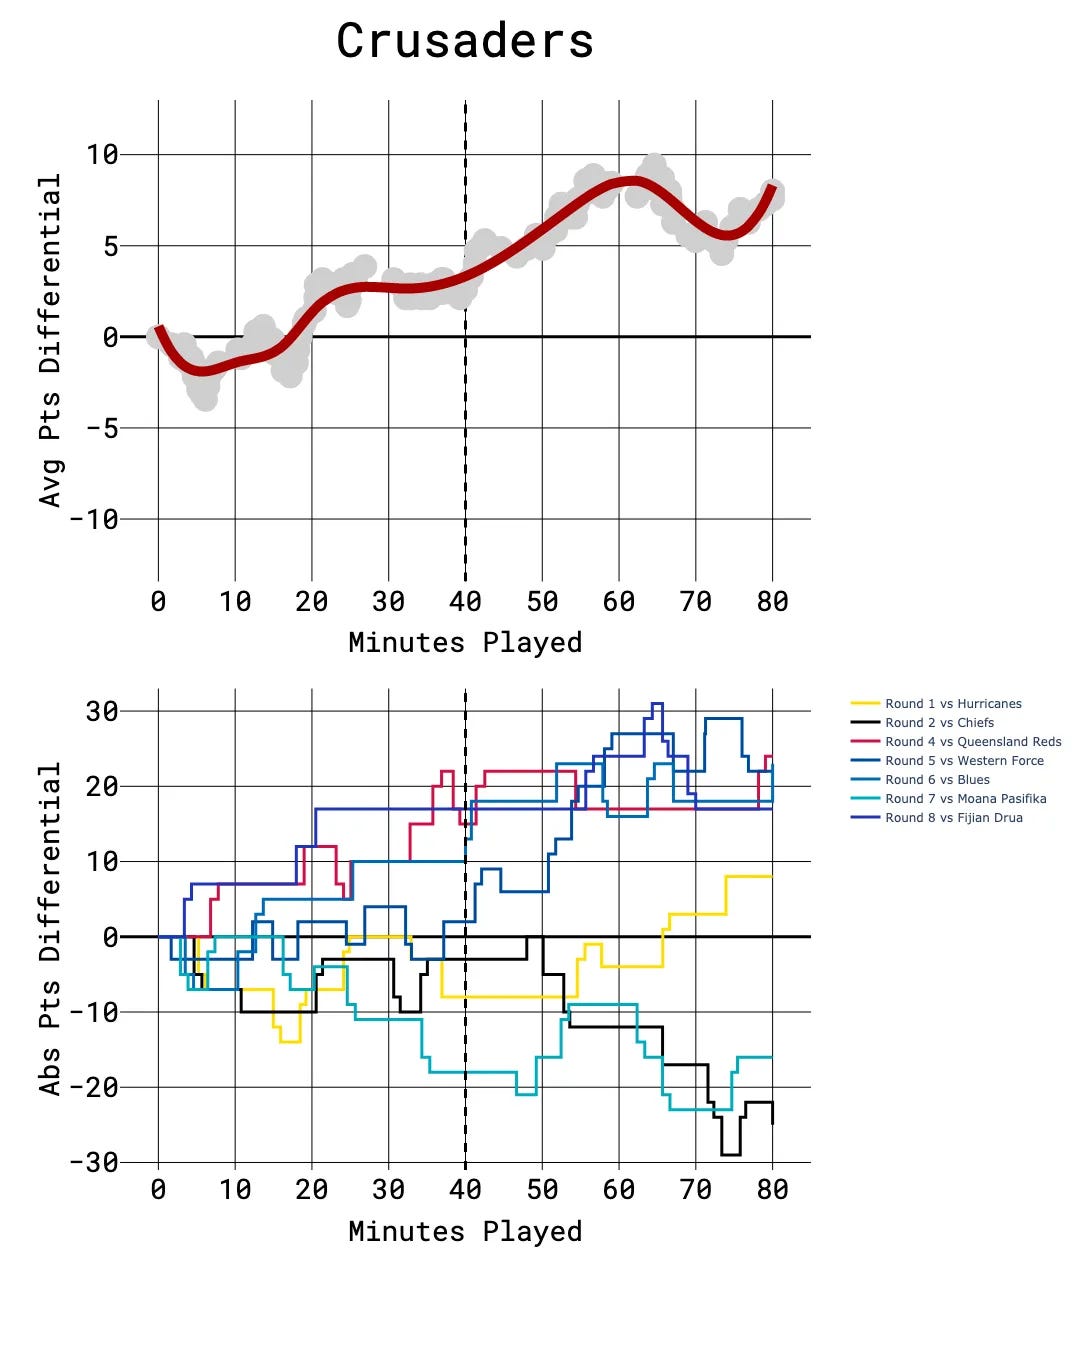
I guess the death of the Crusaders was greatly exaggerated. They don’t explode out of the gate, and things stay pretty even early on, but once the second half kicks off, they go to work. The average differential climbs steadily from around the 50-minute mark, and by full-time they’ve usually built a lead. The individual worms show the same thing: they let the game unfold, keep it close, and then slowly crush you in the final 20 (The JOC effect?). Like the Crusaders of old, they just find a way to win.
Fijian Drua
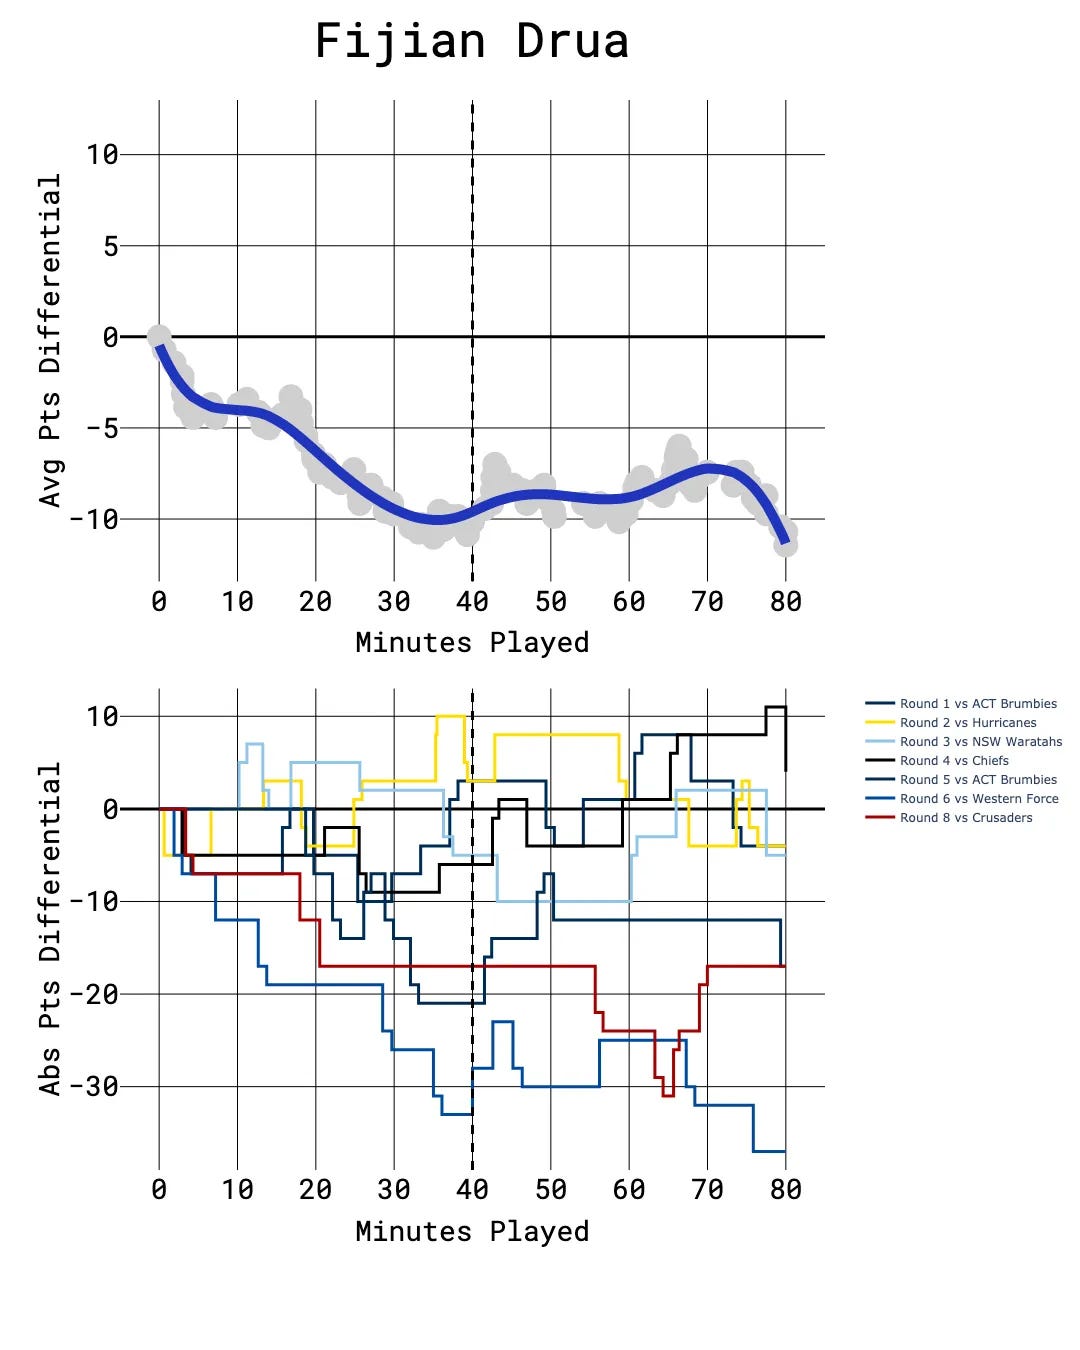
The Drua are chaos merchants, and their curve reflects it. Their average point differential tanks in the opening 20 minutes, which is a shame—because they often claw their way back into games. But the damage is usually done by then. The individual worms show just how early and how often they concede points. We all know you can never count the Drua out, but they make it bloody hard on themselves by spotting the opposition a head start. Right now, it feels like they’re spending too much time playing catch-up.
Highlanders
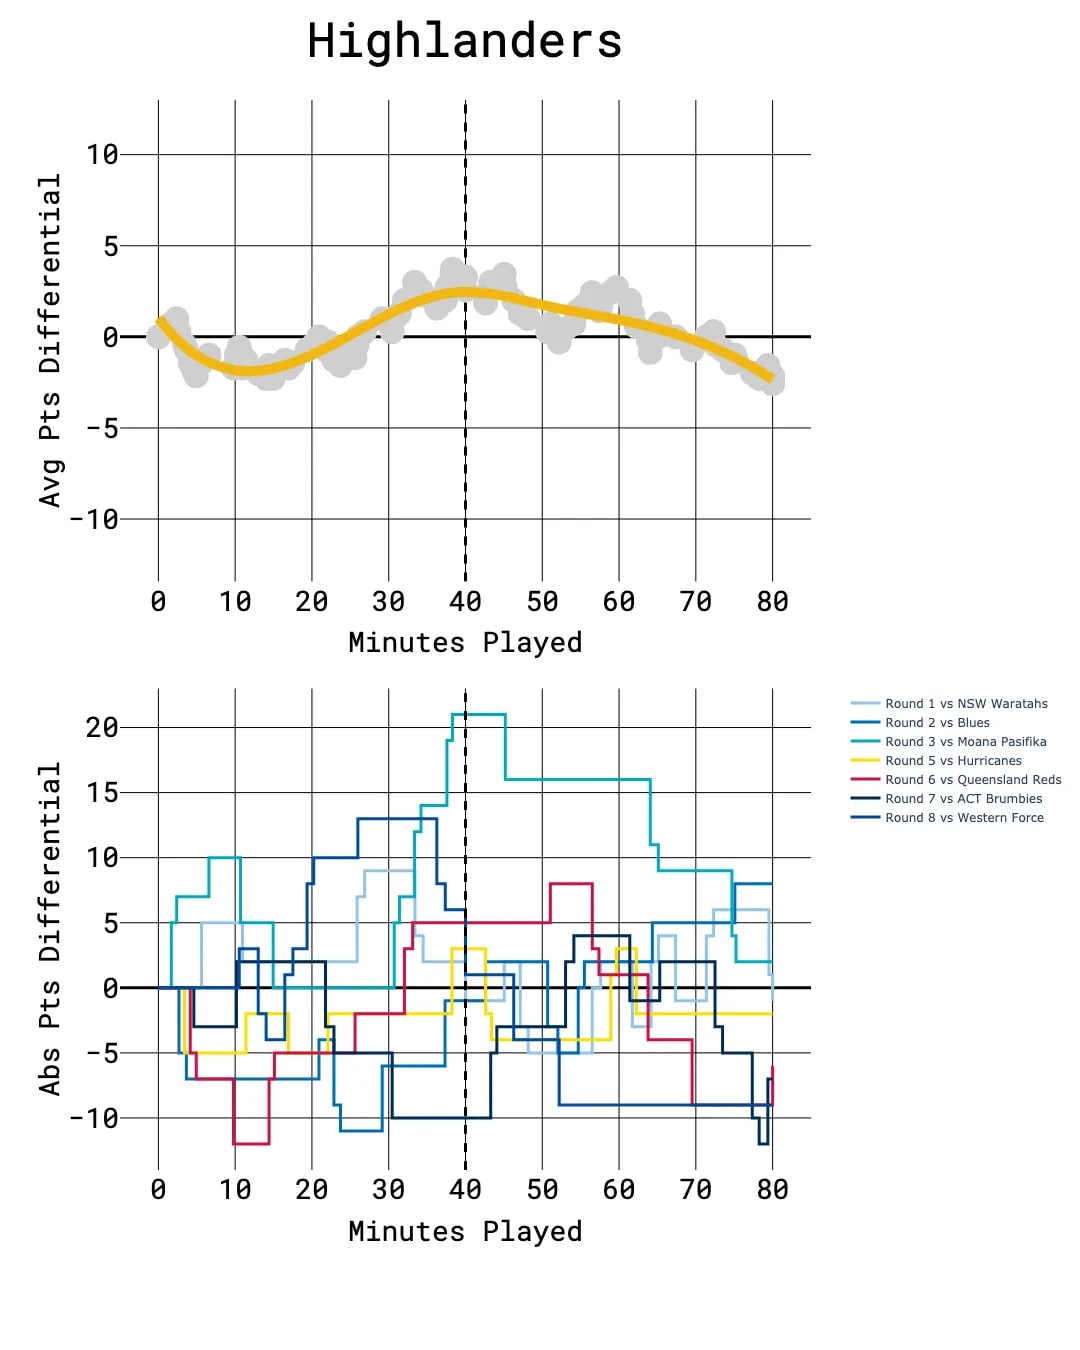
What’s the nicest thing we can say about the Highlanders right now? How about this: they’re quietly competitive through the middle third of matches. Unfortunately, it’s the opening and closing phases where things fall apart. There’s a dip in the first 15–20 minutes, a bit of a recovery, and then a steady decline again after the 60-minute mark. They’re in the fight for long stretches, but struggle to land the final punch. The last 10 minutes of games have been particularly costly.
Hurricanes
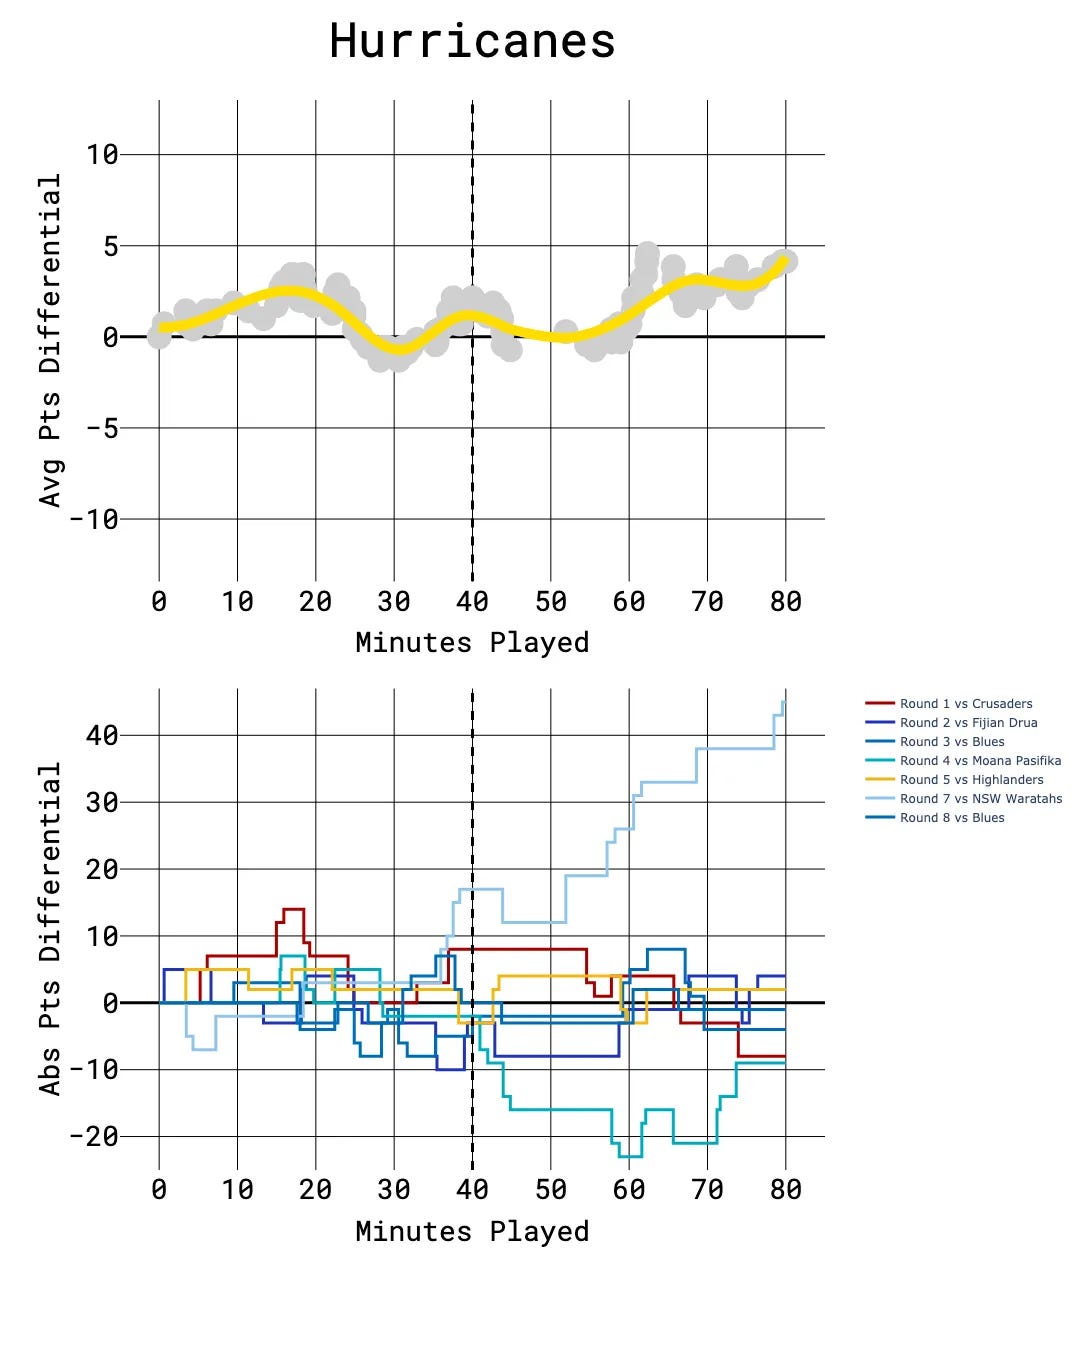
The Canes are just... solid. Their average point differential doesn’t move wildly in either direction—it just stays calmly above zero for most of the match. The individual worms back it up too. There’s a quiet confidence in how they play: never too far ahead, never too far behind, but more often than not, doing just enough. What really stands out is how often they win the final 10 minutes. It’s not a surge—it’s just steady, suffocating pressure that turns close games into wins.
Moana Pasifika
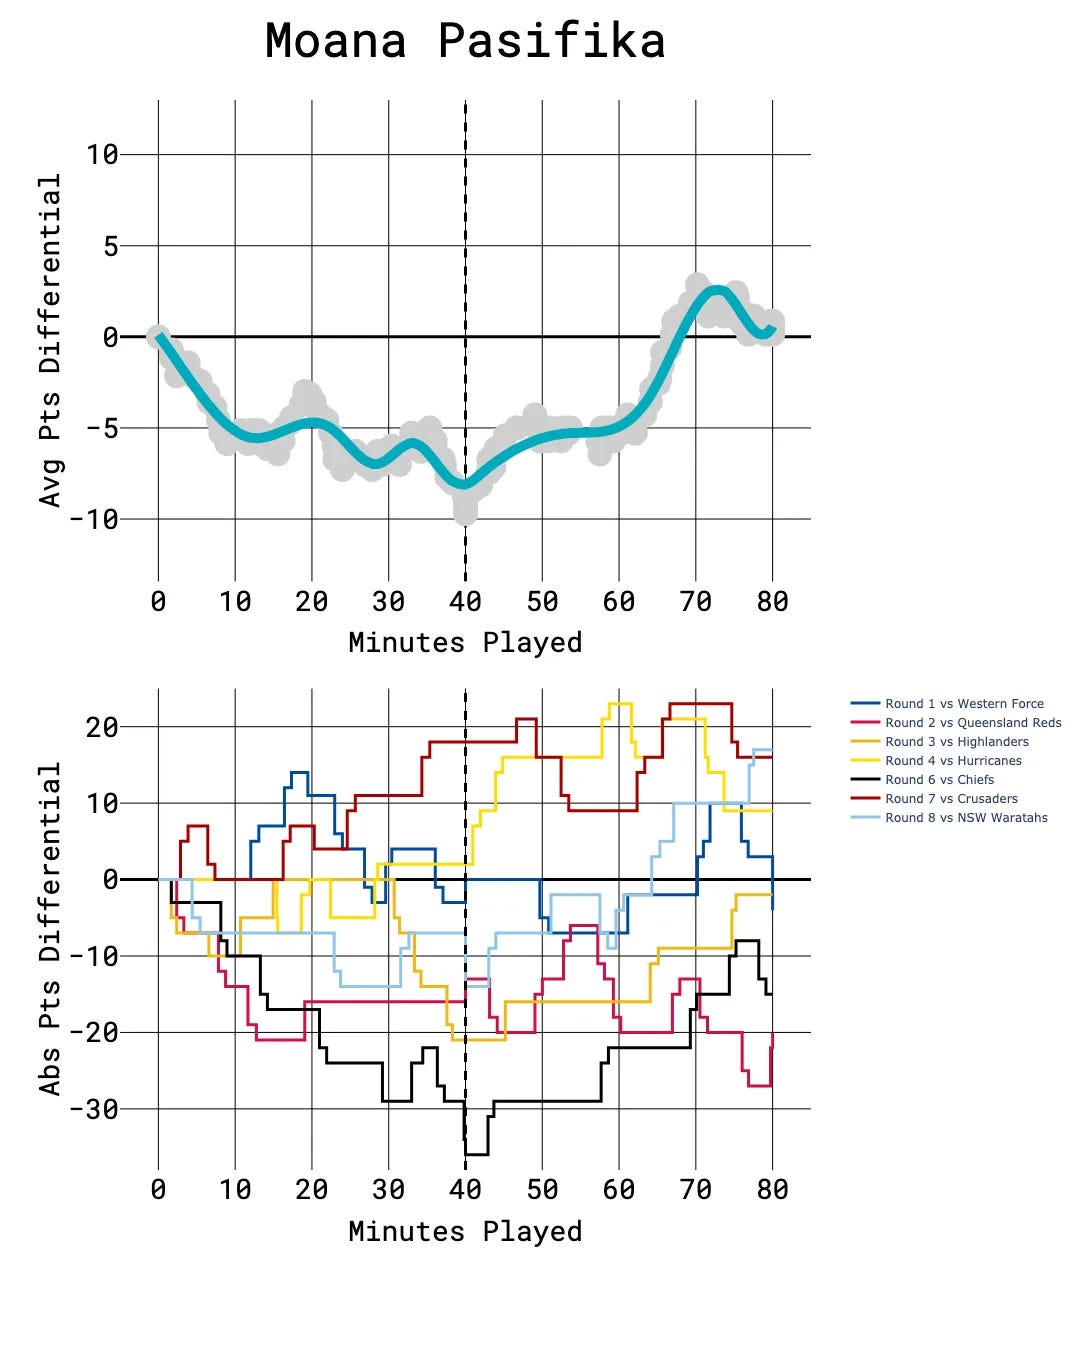
Moana Pasifika are the kings of the near-comeback. They start slow—very slow—and usually find themselves down early. But then they rally. From around the 50-minute mark, their average point differential rises sharply, and they often flip momentum in that first 20 minutes after halftime. The problem? They can’t quite hold it. Just as things are turning their way, they often let it slip again in the final 10 minutes. If they can plug those early and late leaks, they should keep climbing the table as finals approach.
NSW Waratahs
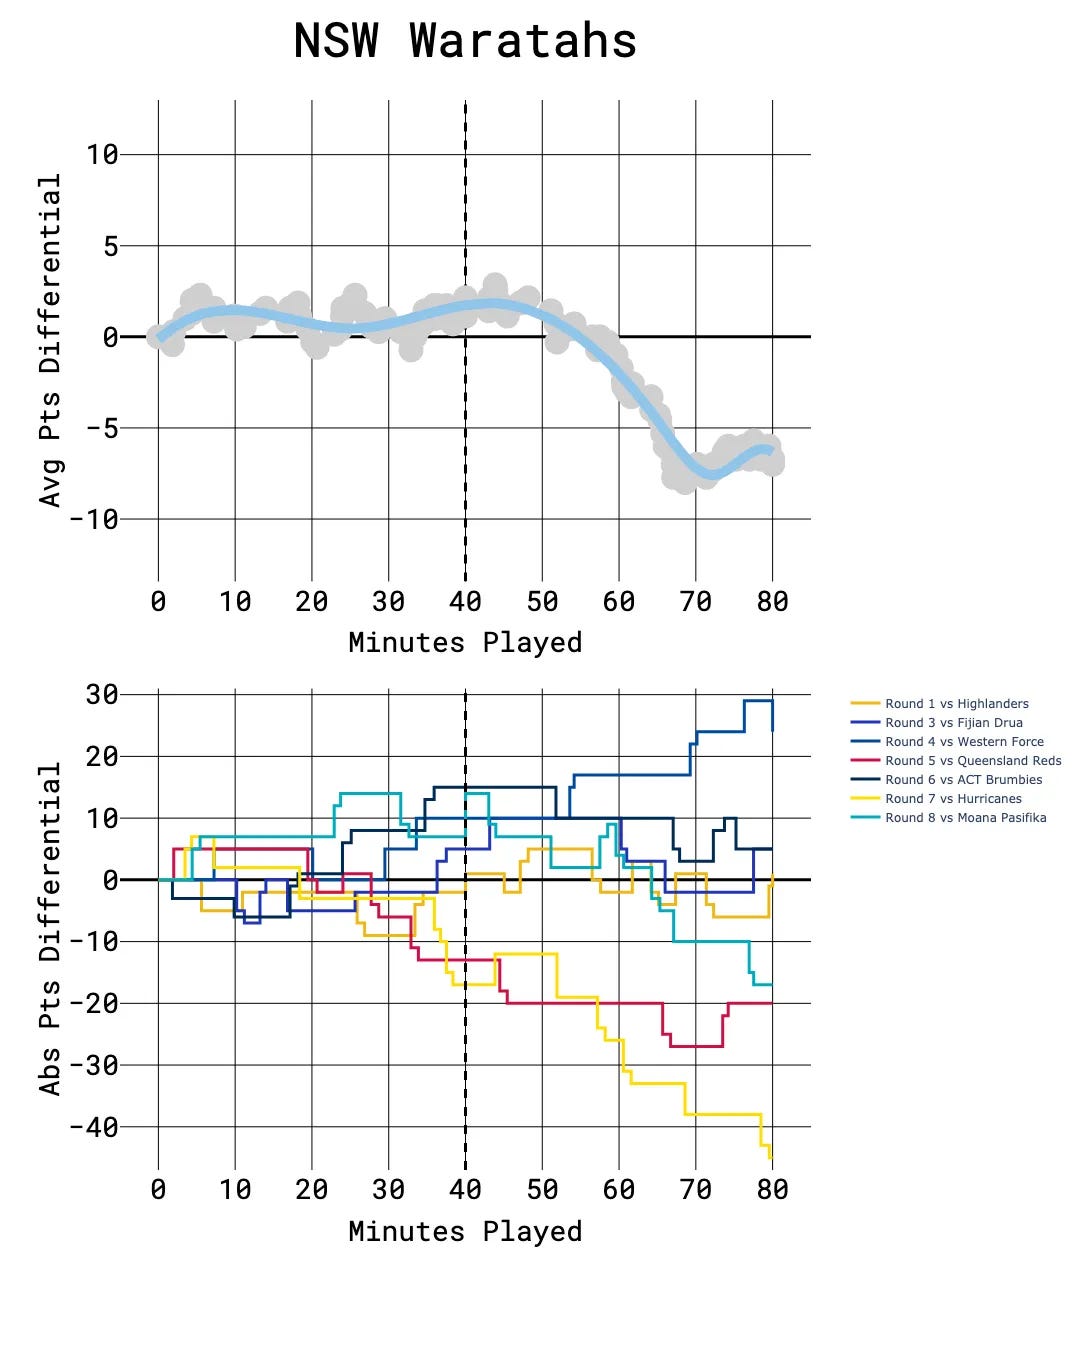
Cliché time! The Tahs are a classic case of two halves. The first half is fine—nothing dramatic, but they’re in the game. The second half? Not so much. From around the 50-minute mark, the decline in differential is sharp and sustained. The average line crashes, and the game-by-game breakdown backs it up with multiple capitulations in the final 20 minutes. They’re not necessarily poor starters, but they’re definitely poor finishers.
Queensland Reds
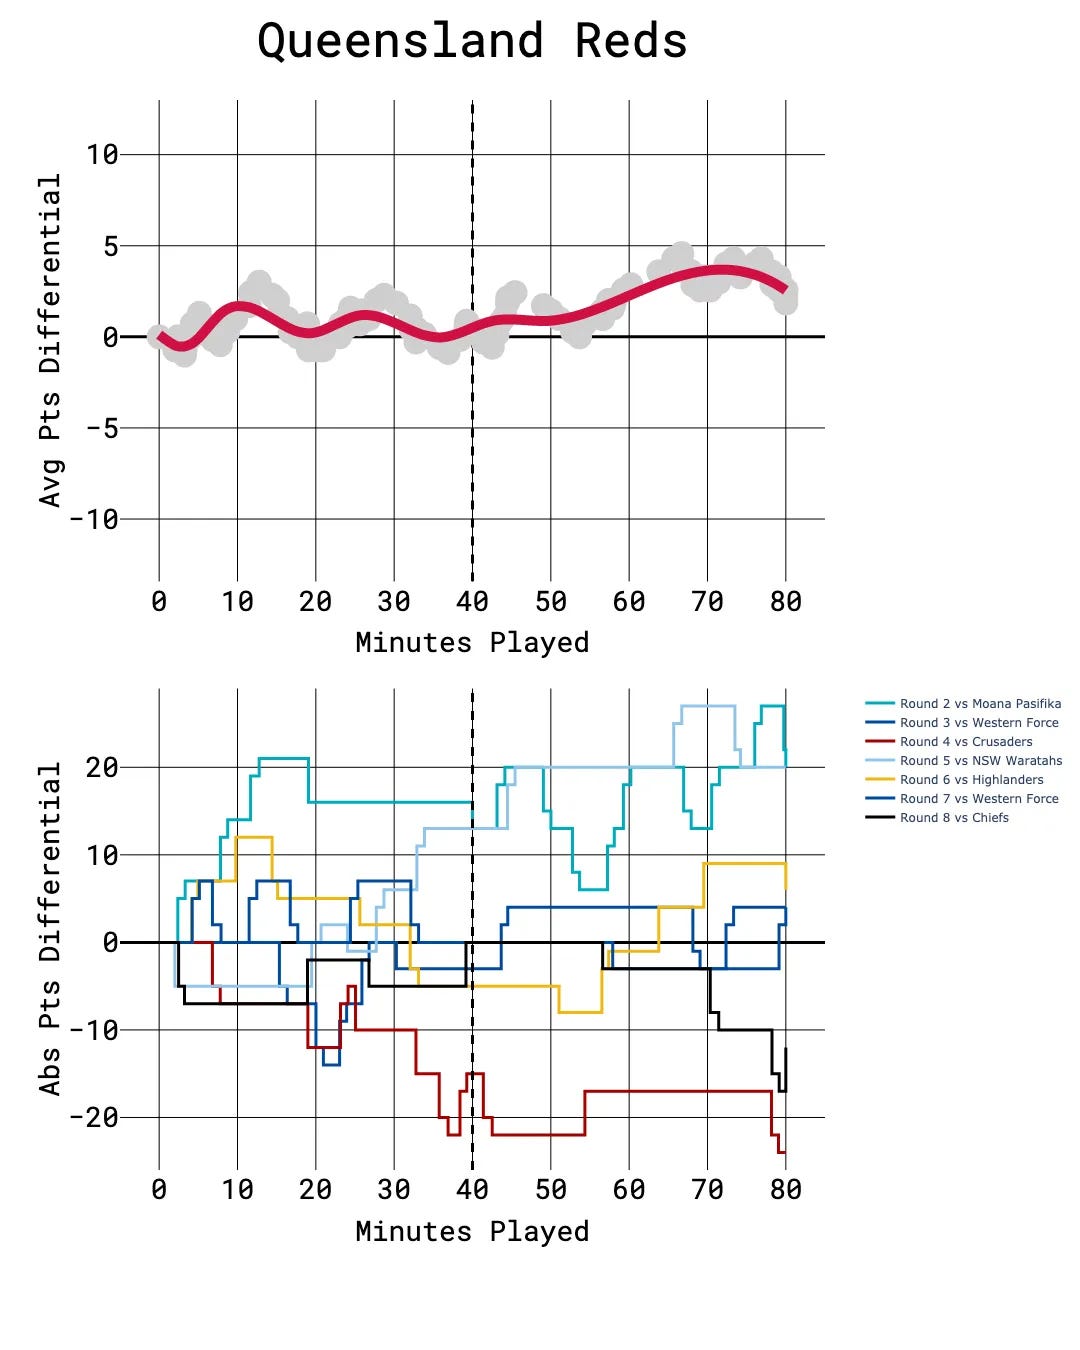
The Reds are hard to build a narrative around because they don’t really have wild swings. Their average differential hovers close to neutral for most of the match, but there’s a gentle, consistent upward trend as the game goes on. They’re rarely dominant, but rarely out of it either. This is a team that builds its advantage slowly—grinding rather than exploding. It might not be the most exciting curve, but it’s the mark of a team that wears you down over time. Right now, they’re clearly Australia’s top side.
Western Force
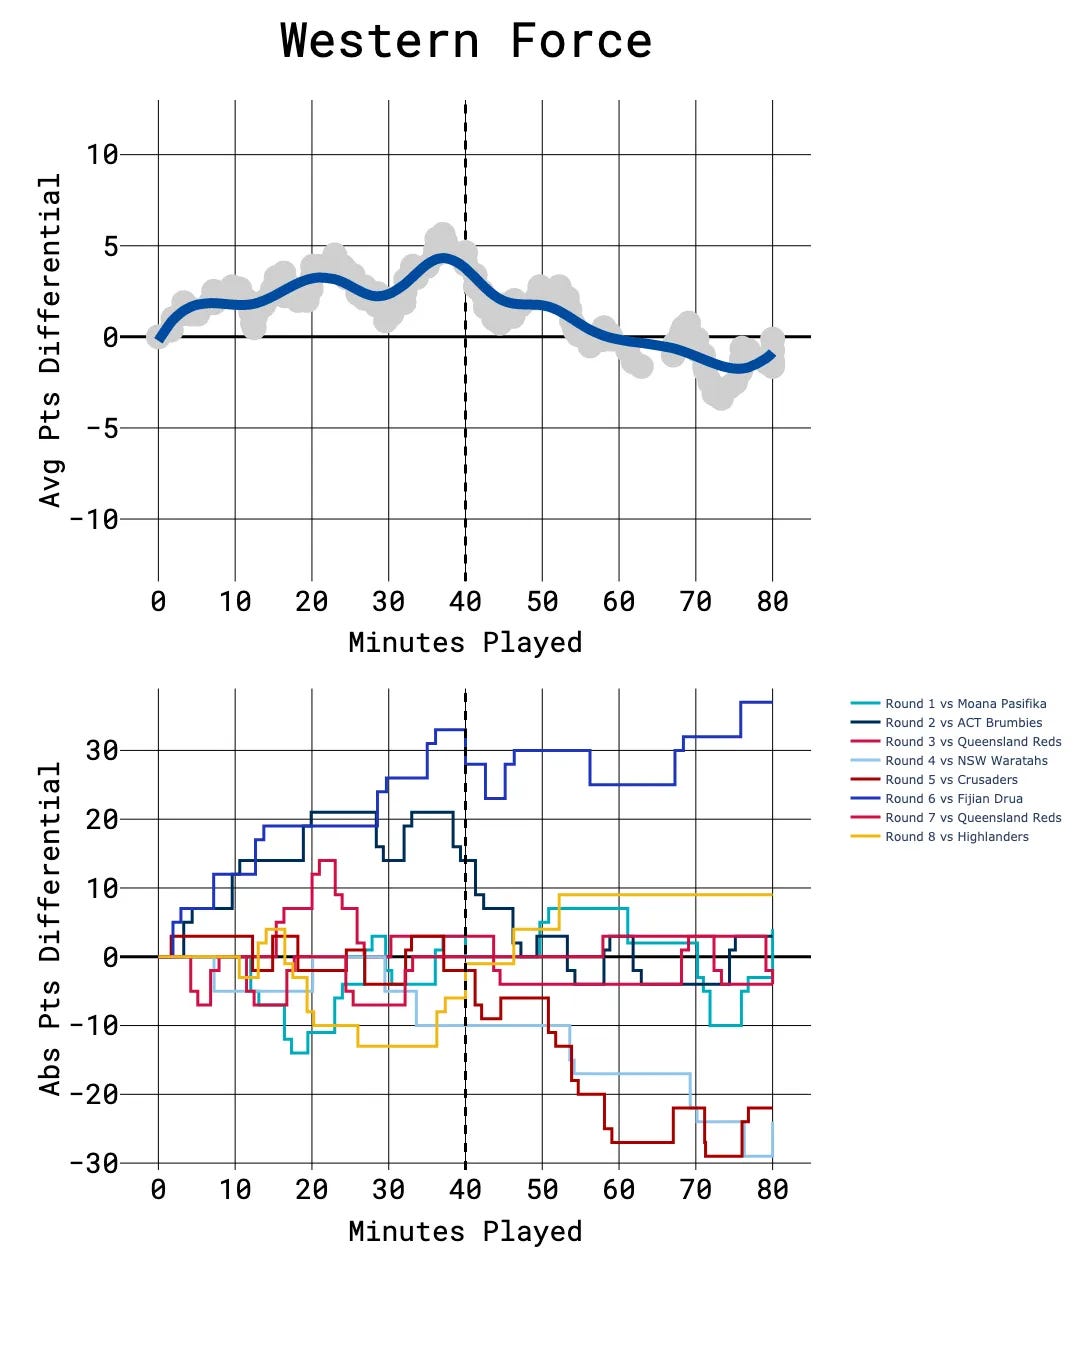
The Force hang in there. Their average point differential in the first half is often flat or even slightly positive. But, like the Waratahs, things take a turn after the break. From the 50-minute mark, they tend to lose ground, and in a few games the wheels have come off completely. The individual worms show they’re not getting blown out early—but they do struggle to keep up late. Still, overall it’s a positive sign for Australia’s fastest improving side.
To illustrate:
If the Reds score a try in the 5th minute of Game 1, their differential from minutes 0–5 is 0, and from minute 5 onward it’s +7 (assuming the kick goes over—Lynagh’s been pretty reliable).
Now add Game 2. Let’s say their opponent nails a penalty in the 2nd minute. The differential from minutes 0–5 is now -1.5: (0 from Game 1 + -3 from Game 2) ÷ 2 games. After minute 5, the average becomes 2: (+7 from Game 1 + -3 from Game 2) ÷ 2.
We repeat this for every score in every game and then draw a nice smoothed curve through all the points to get each team’s average point differential across the 80 minutes.
Can’t wait to see this one updated at the end of round 16
Again,, love this